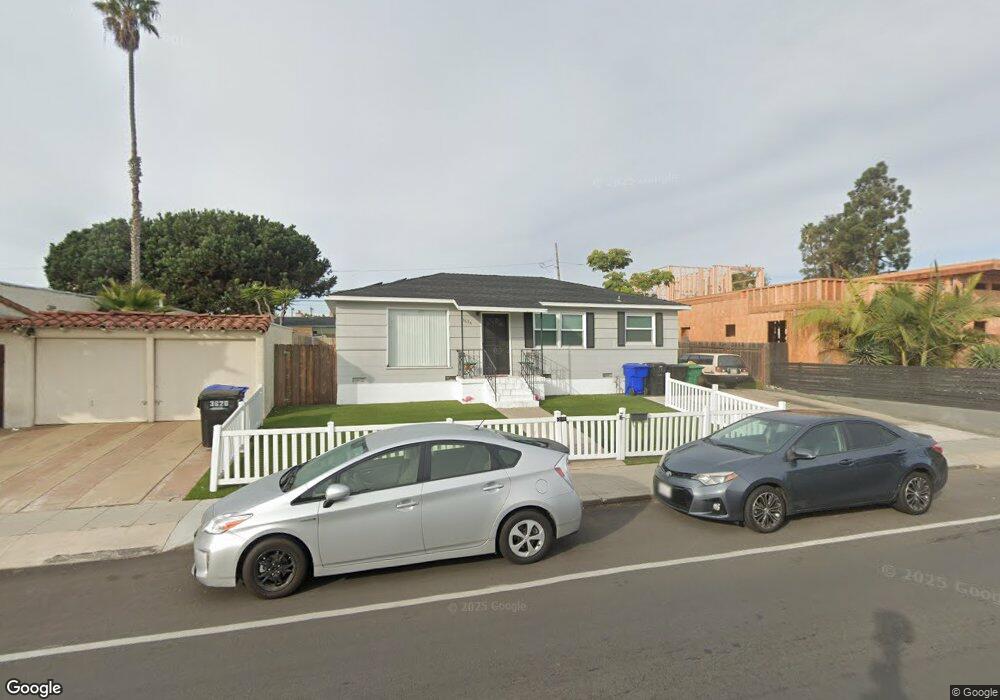
3634 Ingraham St San Diego, CA 92109
Pacific Beach NeighborhoodEstimated Value: $1,120,000 - $1,702,000
3
Beds
1
Bath
1,040
Sq Ft
$1,405/Sq Ft
Est. Value
About This Home
This home is located at 3634 Ingraham St, San Diego, CA 92109 and is currently estimated at $1,461,169, approximately $1,404 per square foot. 3634 Ingraham St is a home located in San Diego County with nearby schools including Crown Point Junior Music Academy, Pacific Beach Middle, and Mission Bay High School.
Ownership History
Date
Name
Owned For
Owner Type
Purchase Details
Closed on
Mar 29, 2022
Sold by
Hines James A
Bought by
Hines James A
Current Estimated Value
Home Financials for this Owner
Home Financials are based on the most recent Mortgage that was taken out on this home.
Original Mortgage
$60,000
Outstanding Balance
$56,602
Interest Rate
4.67%
Mortgage Type
Credit Line Revolving
Estimated Equity
$1,404,567
Purchase Details
Closed on
Feb 14, 2022
Sold by
Hines James A
Bought by
Hines James A
Home Financials for this Owner
Home Financials are based on the most recent Mortgage that was taken out on this home.
Original Mortgage
$60,000
Outstanding Balance
$56,602
Interest Rate
4.67%
Mortgage Type
Credit Line Revolving
Estimated Equity
$1,404,567
Purchase Details
Closed on
Jul 22, 1997
Sold by
Myers 1980 Family Trust and Rodney J
Bought by
Hines John P and Hines Patricia A
Home Financials for this Owner
Home Financials are based on the most recent Mortgage that was taken out on this home.
Original Mortgage
$135,000
Interest Rate
7.54%
Purchase Details
Closed on
Mar 14, 1990
Create a Home Valuation Report for This Property
The Home Valuation Report is an in-depth analysis detailing your home's value as well as a comparison with similar homes in the area
Home Values in the Area
Average Home Value in this Area
Purchase History
| Date | Buyer | Sale Price | Title Company |
|---|---|---|---|
| Hines James A | -- | Wfg Title Insurance | |
| Hines James A | -- | Grossman Scott | |
| Hines John P | $185,000 | Chicago Title Co | |
| -- | $255,000 | -- |
Source: Public Records
Mortgage History
| Date | Status | Borrower | Loan Amount |
|---|---|---|---|
| Open | Hines James A | $60,000 | |
| Open | Hines James A | $255,000 | |
| Previous Owner | Hines John P | $135,000 |
Source: Public Records
Tax History Compared to Growth
Tax History
| Year | Tax Paid | Tax Assessment Tax Assessment Total Assessment is a certain percentage of the fair market value that is determined by local assessors to be the total taxable value of land and additions on the property. | Land | Improvement |
|---|---|---|---|---|
| 2025 | $3,505 | $295,372 | $233,200 | $62,172 |
| 2024 | $3,505 | $289,581 | $228,628 | $60,953 |
| 2023 | $3,426 | $283,904 | $224,146 | $59,758 |
| 2022 | $3,333 | $272,882 | $215,443 | $57,439 |
| 2021 | $3,395 | $272,882 | $215,443 | $57,439 |
| 2020 | $3,354 | $270,085 | $213,234 | $56,851 |
| 2019 | $3,295 | $264,790 | $209,053 | $55,737 |
| 2018 | $3,082 | $259,599 | $204,954 | $54,645 |
| 2017 | $80 | $254,510 | $200,936 | $53,574 |
| 2016 | $2,960 | $249,521 | $196,997 | $52,524 |
| 2015 | $2,916 | $245,774 | $194,038 | $51,736 |
| 2014 | -- | $240,961 | $190,238 | $50,723 |
Source: Public Records
Map
Nearby Homes
- 3705 Haines St
- 3736 Promontory St
- 3616 Buena Vista St
- 3850 Riviera Dr Unit 3B
- 3825 Kendall St
- 3920 Riviera Dr Unit A
- 3328 Crown Point Dr
- 4053-55 Jewell St
- 4073 Riviera Dr
- 4071 Riviera Dr
- 3955 Honeycutt St Unit 201
- 1235 Parker Place Unit 3J
- 1235 Parker Place Unit 2B
- 1221 Parker Place Unit 15
- 3991 Crown Point Dr Unit P13
- 4135 Fanuel St
- 1152-54 Pacific Beach Dr
- 1807 Grand Ave
- 1300 Grand Ave Unit 38, 39
- 841 Pismo Ct
- 3626 Ingraham St
- 3640 Ingraham St
- 3633 Promontory St
- 3622 Ingraham St
- 3646 Ingraham St
- 3639 Promontory St
- 3627 Promontory St
- 3633 Ingraham St
- 3639 Ingraham St
- 3645 Promontory St
- 3621 Promontory St
- 3627 Ingraham St
- 3616 Ingraham St
- 3652 Ingraham St
- 3645 Ingraham St
- 3651 Promontory St
- 3615 Promontory St
- 3651 Ingraham St
- 3610 Ingraham St
- 3640 Yosemite St