36340 Capel Rd Grafton, OH 44044
Estimated Value: $406,000 - $504,992
3
Beds
2
Baths
2,504
Sq Ft
$181/Sq Ft
Est. Value
About This Home
This home is located at 36340 Capel Rd, Grafton, OH 44044 and is currently estimated at $452,248, approximately $180 per square foot. 36340 Capel Rd is a home located in Lorain County with nearby schools including Midview West Elementary School, Midview North Elementary School, and Midview East Intermediate School.
Ownership History
Date
Name
Owned For
Owner Type
Purchase Details
Closed on
Jul 19, 2025
Sold by
Surman David E and Surman Lisa L
Bought by
Surman David E and Surman Lisa L
Current Estimated Value
Purchase Details
Closed on
Mar 25, 2004
Sold by
Parkinson Diane M
Bought by
Surman David E and Surman Lisa L
Home Financials for this Owner
Home Financials are based on the most recent Mortgage that was taken out on this home.
Original Mortgage
$204,000
Interest Rate
5.74%
Mortgage Type
Purchase Money Mortgage
Purchase Details
Closed on
Aug 30, 1995
Sold by
Haynes Ronald F
Bought by
Parkinson Diane M
Home Financials for this Owner
Home Financials are based on the most recent Mortgage that was taken out on this home.
Original Mortgage
$122,400
Interest Rate
7.55%
Mortgage Type
New Conventional
Create a Home Valuation Report for This Property
The Home Valuation Report is an in-depth analysis detailing your home's value as well as a comparison with similar homes in the area
Home Values in the Area
Average Home Value in this Area
Purchase History
| Date | Buyer | Sale Price | Title Company |
|---|---|---|---|
| Surman David E | -- | None Listed On Document | |
| Surman David E | $240,000 | Premier Title | |
| Parkinson Diane M | $153,000 | -- |
Source: Public Records
Mortgage History
| Date | Status | Borrower | Loan Amount |
|---|---|---|---|
| Previous Owner | Surman David E | $204,000 | |
| Previous Owner | Parkinson Diane M | $122,400 |
Source: Public Records
Tax History Compared to Growth
Tax History
| Year | Tax Paid | Tax Assessment Tax Assessment Total Assessment is a certain percentage of the fair market value that is determined by local assessors to be the total taxable value of land and additions on the property. | Land | Improvement |
|---|---|---|---|---|
| 2024 | $7,845 | $165,400 | $86,310 | $79,090 |
| 2023 | $5,186 | $96,460 | $37,555 | $58,905 |
| 2022 | $5,097 | $96,460 | $37,555 | $58,905 |
| 2021 | $5,111 | $96,460 | $37,555 | $58,905 |
| 2020 | $6,273 | $80,260 | $31,250 | $49,010 |
| 2019 | $4,058 | $80,260 | $31,250 | $49,010 |
| 2018 | $4,116 | $80,260 | $31,250 | $49,010 |
| 2017 | $4,131 | $70,900 | $28,190 | $42,710 |
| 2016 | $4,184 | $70,900 | $28,190 | $42,710 |
| 2015 | $4,205 | $70,900 | $28,190 | $42,710 |
| 2014 | $2,481 | $70,900 | $28,190 | $42,710 |
| 2013 | $2,481 | $70,900 | $28,190 | $42,710 |
Source: Public Records
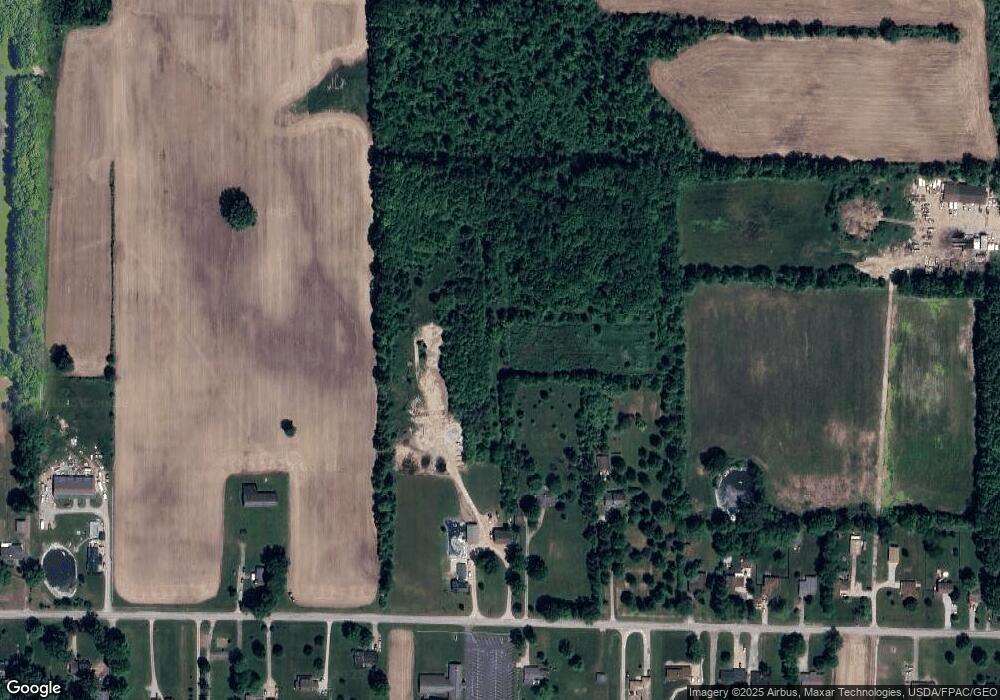
Map
Nearby Homes
- 37340 Capel Rd
- 35293 Elm Rd
- V/L Capel Rd
- 11855 Avon Belden Rd
- 12159 Alton Dr
- Grand Cayman w/ Finished Basement Plan at Eaton Crossing
- Eden Cay w/ Finished Basement Plan at Eaton Crossing
- Grand Bahama w/ Finished Basement Plan at Eaton Crossing
- Aruba Bay W/ Covered Porch Plan at Eaton Crossing
- 1041 Plymouth Dr
- 1077 Yarmouth Rd
- 11950 Castleton Ln
- 1099 Huntsman Ct
- 1013 N Willow St
- 1129 Fox Run
- 694 Erie St
- 551 N Main St
- 1166 Hunting Hollow
- 697 Main St
- 1167 Fox Run