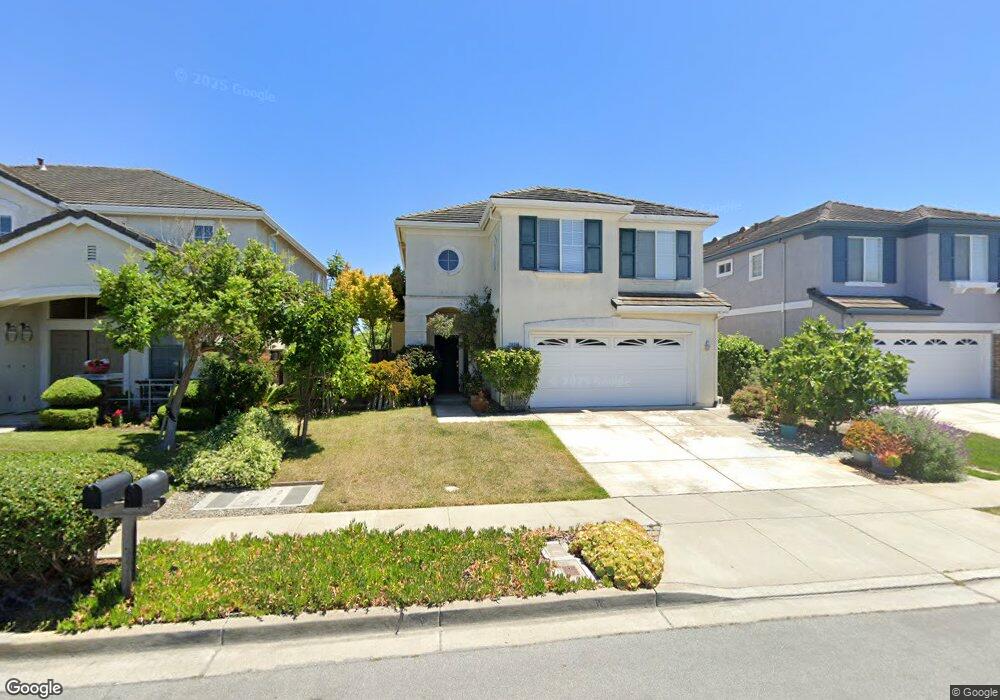
36346 Crystal Springs Ct Newark, CA 94560
Estimated Value: $1,683,475 - $1,871,000
4
Beds
3
Baths
2,317
Sq Ft
$767/Sq Ft
Est. Value
About This Home
This home is located at 36346 Crystal Springs Ct, Newark, CA 94560 and is currently estimated at $1,776,119, approximately $766 per square foot. 36346 Crystal Springs Ct is a home located in Alameda County with nearby schools including Lincoln Elementary School, Newark Junior High School, and Newark Memorial High School.
Ownership History
Date
Name
Owned For
Owner Type
Purchase Details
Closed on
May 26, 2010
Sold by
Kaniyur Narayanan and Rajagopalan Lalitha
Bought by
Yu Lixin and Kang Li
Current Estimated Value
Home Financials for this Owner
Home Financials are based on the most recent Mortgage that was taken out on this home.
Original Mortgage
$536,000
Outstanding Balance
$360,636
Interest Rate
5.05%
Mortgage Type
New Conventional
Estimated Equity
$1,415,483
Purchase Details
Closed on
Mar 9, 2001
Sold by
Lee Clarence C and Lee Fengmin S
Bought by
Kaniyur Narayanan and Rajagopalan Lalitha
Home Financials for this Owner
Home Financials are based on the most recent Mortgage that was taken out on this home.
Original Mortgage
$564,000
Interest Rate
6.87%
Purchase Details
Closed on
Dec 12, 1998
Sold by
Pulte Home Corp
Bought by
Lee Clarence C and Lee Feng Min S
Home Financials for this Owner
Home Financials are based on the most recent Mortgage that was taken out on this home.
Original Mortgage
$350,000
Interest Rate
6.82%
Create a Home Valuation Report for This Property
The Home Valuation Report is an in-depth analysis detailing your home's value as well as a comparison with similar homes in the area
Home Values in the Area
Average Home Value in this Area
Purchase History
| Date | Buyer | Sale Price | Title Company |
|---|---|---|---|
| Yu Lixin | $676,000 | Old Republic Title Company | |
| Kaniyur Narayanan | $705,000 | American Title Co | |
| Lee Clarence C | $446,000 | Chicago Title Co |
Source: Public Records
Mortgage History
| Date | Status | Borrower | Loan Amount |
|---|---|---|---|
| Open | Yu Lixin | $536,000 | |
| Previous Owner | Kaniyur Narayanan | $564,000 | |
| Previous Owner | Lee Clarence C | $350,000 | |
| Closed | Kaniyur Narayanan | $105,750 |
Source: Public Records
Tax History Compared to Growth
Tax History
| Year | Tax Paid | Tax Assessment Tax Assessment Total Assessment is a certain percentage of the fair market value that is determined by local assessors to be the total taxable value of land and additions on the property. | Land | Improvement |
|---|---|---|---|---|
| 2025 | $10,752 | $865,403 | $261,630 | $610,773 |
| 2024 | $10,752 | $848,303 | $256,502 | $598,801 |
| 2023 | $10,471 | $838,534 | $251,473 | $587,061 |
| 2022 | $10,349 | $815,097 | $246,544 | $575,553 |
| 2021 | $10,093 | $798,983 | $241,711 | $564,272 |
| 2020 | $9,985 | $797,723 | $239,234 | $558,489 |
| 2019 | $9,843 | $782,083 | $234,544 | $547,539 |
| 2018 | $9,701 | $766,753 | $229,946 | $536,807 |
| 2017 | $9,460 | $751,721 | $225,438 | $526,283 |
| 2016 | $9,371 | $736,987 | $221,020 | $515,967 |
| 2015 | $9,340 | $725,922 | $217,701 | $508,221 |
| 2014 | $9,095 | $711,709 | $213,439 | $498,270 |
Source: Public Records
Map
Nearby Homes
- 36075 Crystal Springs Dr
- 35914 Burning Tree Dr
- 7574 Birkdale Dr
- 6793 Flanders Dr
- 36184 Toulouse St
- 6740 Normandy Dr
- 6831 Cabernet Ave
- 37000 Poplar St Unit 37006
- 7698 Redbud Ct
- 37256 Sand Bar Place
- 6588 Flanders Dr
- 36985 Walnut St
- 9174 Enterprise Dr
- 36466 Haley St
- 36563 Beutke Dr
- 37051 Walnut St
- 9263 Vista Cove Way
- 37413 Bowline Rd
- 35421 Cleremont Dr
- 7843 Railroad Ave
- 36358 Crystal Springs Ct
- 36334 Crystal Springs Ct
- 36322 Crystal Springs Ct
- 36370 Crystal Springs Ct
- 36369 Crystal Springs Ct
- 36310 Crystal Springs Ct
- 36382 Crystal Springs Ct
- 36229 Kiote Dr
- 36298 Crystal Springs Dr
- 36394 Crystal Springs Ct
- 36381 Crystal Springs Ct
- 36217 Kiote Dr
- 36286 Crystal Springs Dr
- 36195 Kiote Dr
- 36406 Crystal Springs Ct
- 36393 Crystal Springs Ct
- 36405 Crystal Springs Ct
- 36418 Crystal Springs Ct
- 36183 Kiote Dr
- 36274 Crystal Springs Dr