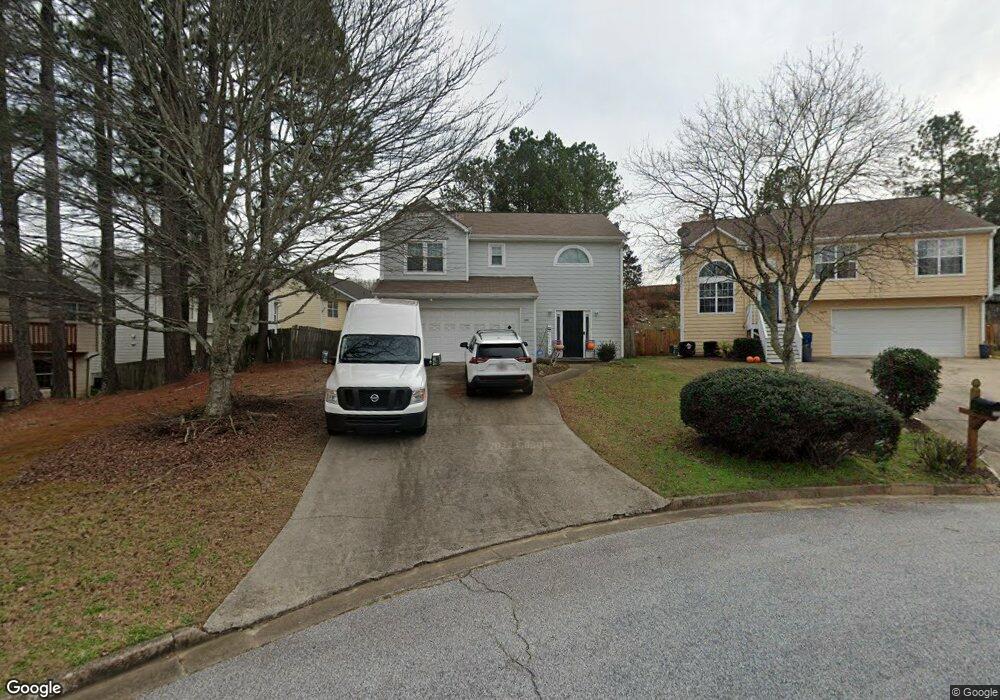
3635 Darwin Place Duluth, GA 30096
Estimated Value: $328,000 - $402,000
3
Beds
3
Baths
1,860
Sq Ft
$204/Sq Ft
Est. Value
About This Home
This home is located at 3635 Darwin Place, Duluth, GA 30096 and is currently estimated at $379,682, approximately $204 per square foot. 3635 Darwin Place is a home located in Gwinnett County with nearby schools including Chattahoochee Elementary School, Coleman Middle School, and Duluth High School.
Ownership History
Date
Name
Owned For
Owner Type
Purchase Details
Closed on
Jan 15, 2025
Sold by
Darwin Revocable Trust
Bought by
Gentry Juliana C
Current Estimated Value
Home Financials for this Owner
Home Financials are based on the most recent Mortgage that was taken out on this home.
Original Mortgage
$207,265
Outstanding Balance
$205,424
Interest Rate
6.72%
Mortgage Type
New Conventional
Estimated Equity
$174,258
Purchase Details
Closed on
Jun 30, 1997
Sold by
Yen Emily
Bought by
Gentry Ricky D and Gentry Juliana
Home Financials for this Owner
Home Financials are based on the most recent Mortgage that was taken out on this home.
Original Mortgage
$89,600
Interest Rate
7.87%
Mortgage Type
New Conventional
Purchase Details
Closed on
Oct 16, 1995
Sold by
Lopez Edward D Mary E
Bought by
Yen Emily
Create a Home Valuation Report for This Property
The Home Valuation Report is an in-depth analysis detailing your home's value as well as a comparison with similar homes in the area
Home Values in the Area
Average Home Value in this Area
Purchase History
| Date | Buyer | Sale Price | Title Company |
|---|---|---|---|
| Gentry Juliana C | -- | -- | |
| Gentry Ricky D | $112,000 | -- | |
| Yen Emily | $106,000 | -- |
Source: Public Records
Mortgage History
| Date | Status | Borrower | Loan Amount |
|---|---|---|---|
| Open | Gentry Juliana C | $207,265 | |
| Previous Owner | Gentry Ricky D | $89,600 | |
| Closed | Yen Emily | $0 |
Source: Public Records
Map
Nearby Homes
- 3543 Benthollow Way
- 3929 Meeting St
- 3923 Meeting St
- 3485 Parkbrooke Ln
- 3835 Meeting St
- 3378 Willbrooke Ct
- 3345 Howell Cir
- 3310 McClure Woods Ct
- 3515 Senna Rd
- 3752 Berkeley Crossing
- 3295 Dundee Ridge Way
- 3767 Berkeley Crossing
- 3360 Ennfield Ln
- 3460 Hardy St
- 3801 Thayer Trace
- 3207 Hill St
- 3452 Pittard Rd
- 3132 Pittard Hill Point
- 3598 Parkridge Pointe
- 3110 Pittard Hill Point
- 3635 Darwin Place Unit 3635
- 3635 Darwin Place
- 3625 Darwin Place Unit 5
- 3921 Sidney Lanier Blvd Unit 5
- 3915 Sidney Lanier Blvd Unit 5
- 3915 Sidney Lanier Blvd
- 3911 Sidney Lanier Blvd Unit 5
- 3925 Sidney Lanier Blvd
- 3615 Darwin Place
- 3929 Sidney Lanier Blvd
- 3626 Gray Place
- 3935 Sidney Lanier Blvd Unit 69
- 3935 Sidney Lanier Blvd
- 3935 Sidney Lanier Blvd Unit 5
- 3636 Gray Place
- 3605 Darwin Place
- 3616 Gray Place
- 3640 Darwin Place
- 3600 Darwin Place
- 3912 Sidney Lanier Blvd Unit 4
Your Personal Tour Guide
Ask me questions while you tour the home.