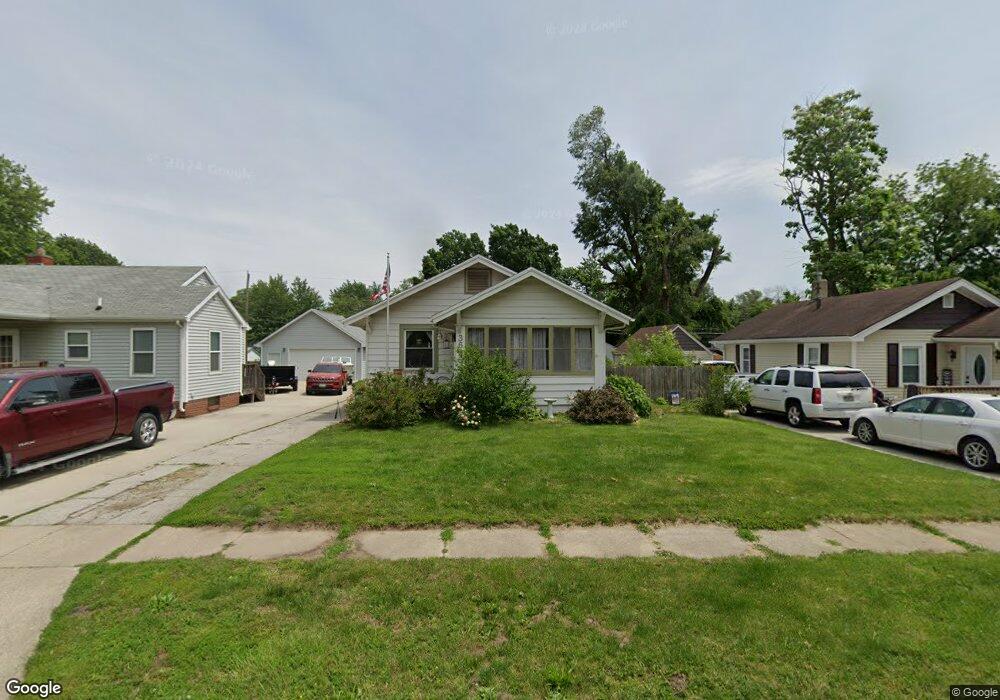
3635 E 7th St Des Moines, IA 50316
Highland Park NeighborhoodEstimated Value: $138,258 - $184,000
2
Beds
2
Baths
790
Sq Ft
$198/Sq Ft
Est. Value
About This Home
This home is located at 3635 E 7th St, Des Moines, IA 50316 and is currently estimated at $156,065, approximately $197 per square foot. 3635 E 7th St is a home located in Polk County with nearby schools including Madison Elementary School, Harding Middle School, and North High School.
Ownership History
Date
Name
Owned For
Owner Type
Purchase Details
Closed on
Oct 31, 2001
Sold by
Richards Jayme Rae and Richards Steven K
Bought by
Osborne Hollie J
Current Estimated Value
Home Financials for this Owner
Home Financials are based on the most recent Mortgage that was taken out on this home.
Original Mortgage
$69,255
Outstanding Balance
$26,931
Interest Rate
6.8%
Estimated Equity
$129,134
Purchase Details
Closed on
Jan 14, 1999
Sold by
Hadala Jayme Rae
Bought by
Hadala Jayme Rae and Richards Steven K
Home Financials for this Owner
Home Financials are based on the most recent Mortgage that was taken out on this home.
Original Mortgage
$59,050
Interest Rate
6.79%
Purchase Details
Closed on
Jan 4, 1999
Sold by
Shaner Ryan E and Shaner Tracie R Gilbert
Bought by
Hadala Jayme Rae
Home Financials for this Owner
Home Financials are based on the most recent Mortgage that was taken out on this home.
Original Mortgage
$59,050
Interest Rate
6.79%
Create a Home Valuation Report for This Property
The Home Valuation Report is an in-depth analysis detailing your home's value as well as a comparison with similar homes in the area
Home Values in the Area
Average Home Value in this Area
Purchase History
| Date | Buyer | Sale Price | Title Company |
|---|---|---|---|
| Osborne Hollie J | $72,500 | -- | |
| Hadala Jayme Rae | -- | -- | |
| Hadala Jayme Rae | $60,500 | -- |
Source: Public Records
Mortgage History
| Date | Status | Borrower | Loan Amount |
|---|---|---|---|
| Open | Osborne Hollie J | $69,255 | |
| Previous Owner | Hadala Jayme Rae | $59,050 |
Source: Public Records
Tax History
| Year | Tax Paid | Tax Assessment Tax Assessment Total Assessment is a certain percentage of the fair market value that is determined by local assessors to be the total taxable value of land and additions on the property. | Land | Improvement |
|---|---|---|---|---|
| 2025 | $1,802 | $119,200 | $33,300 | $85,900 |
| 2024 | $1,802 | $102,100 | $28,600 | $73,500 |
| 2023 | $1,656 | $102,100 | $28,600 | $73,500 |
| 2022 | $1,640 | $79,100 | $23,000 | $56,100 |
| 2021 | $1,512 | $79,100 | $23,000 | $56,100 |
| 2020 | $1,566 | $69,200 | $20,200 | $49,000 |
| 2019 | $1,442 | $69,200 | $20,200 | $49,000 |
| 2018 | $1,422 | $62,200 | $17,900 | $44,300 |
| 2017 | $1,258 | $62,200 | $17,900 | $44,300 |
| 2016 | $1,328 | $55,000 | $16,100 | $38,900 |
| 2015 | $1,328 | $59,100 | $16,100 | $43,000 |
| 2014 | $1,334 | $58,900 | $15,900 | $43,000 |
Source: Public Records
Map
Nearby Homes
- 704 E Euclid Ave
- 3701 Amherst St
- 3633 Bowdoin St
- 3805 Bowdoin St
- 3803 Bowdoin St
- 3421 Amherst St
- 616 E Ovid Ave
- 3507 Bowdoin St
- 3832 Bowdoin St
- 3814 Columbia St
- 3301 Amherst St
- 3210 E 7th St
- 4012 Amherst St
- 3221 E 12th St
- 3301 Columbia St
- 3615 Cambridge St
- 3914 Cornell St
- 3905 Cambridge St
- 503 E Tiffin Ave
- 4019 Columbia St
Your Personal Tour Guide
Ask me questions while you tour the home.