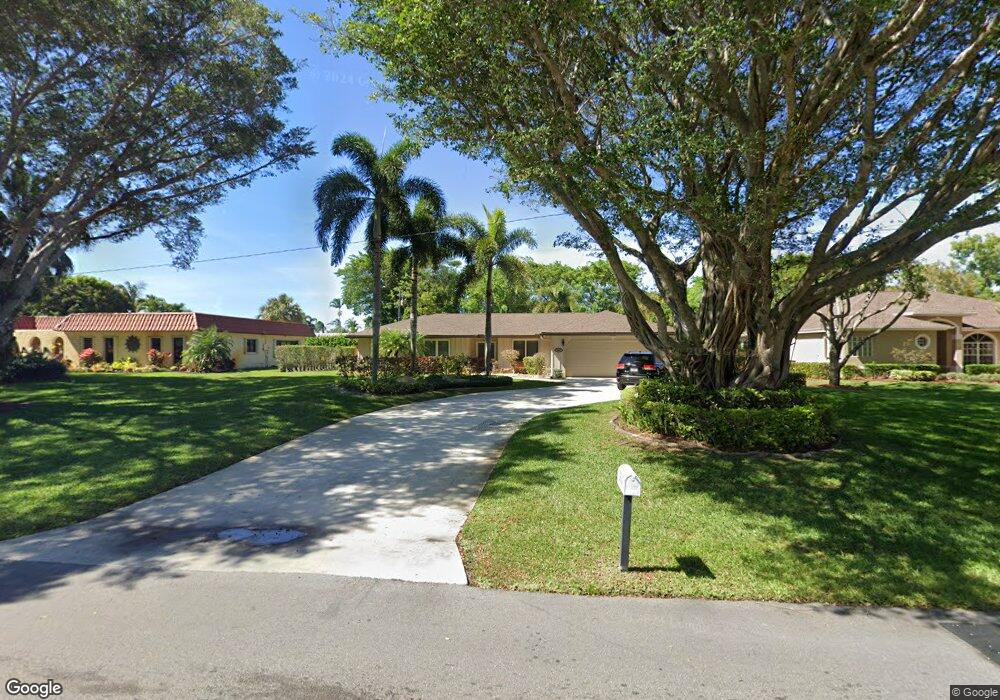
3637 Lowson Blvd Delray Beach, FL 33445
Sherwood Lakeview NeighborhoodEstimated Value: $847,000 - $1,045,000
3
Beds
3
Baths
2,400
Sq Ft
$387/Sq Ft
Est. Value
About This Home
This home is located at 3637 Lowson Blvd, Delray Beach, FL 33445 and is currently estimated at $929,329, approximately $387 per square foot. 3637 Lowson Blvd is a home located in Palm Beach County with nearby schools including Orchard View Elementary School, Carver Community Middle School, and Atlantic High School.
Ownership History
Date
Name
Owned For
Owner Type
Purchase Details
Closed on
May 2, 2008
Sold by
Addis Howard C and Addis Linda Sue
Bought by
Raulin Mark and Raulin Tracey
Current Estimated Value
Home Financials for this Owner
Home Financials are based on the most recent Mortgage that was taken out on this home.
Original Mortgage
$336,000
Outstanding Balance
$209,264
Interest Rate
5.82%
Mortgage Type
Purchase Money Mortgage
Estimated Equity
$720,065
Purchase Details
Closed on
Aug 31, 1995
Sold by
Smith Gregory James and Smith Louise Amy
Bought by
Addis Howard C and Addis Linda Sue
Home Financials for this Owner
Home Financials are based on the most recent Mortgage that was taken out on this home.
Original Mortgage
$129,000
Interest Rate
7.58%
Purchase Details
Closed on
Jun 10, 1993
Sold by
Smith Gregory J and Smith Louise A
Bought by
Smith Gregory J and Smith Louise A
Create a Home Valuation Report for This Property
The Home Valuation Report is an in-depth analysis detailing your home's value as well as a comparison with similar homes in the area
Home Values in the Area
Average Home Value in this Area
Purchase History
| Date | Buyer | Sale Price | Title Company |
|---|---|---|---|
| Raulin Mark | $420,000 | Palmetto Park Title Svcs Inc | |
| Addis Howard C | $173,000 | -- | |
| Smith Gregory J | -- | -- |
Source: Public Records
Mortgage History
| Date | Status | Borrower | Loan Amount |
|---|---|---|---|
| Open | Raulin Mark | $336,000 | |
| Previous Owner | Addis Howard C | $129,000 |
Source: Public Records
Tax History Compared to Growth
Tax History
| Year | Tax Paid | Tax Assessment Tax Assessment Total Assessment is a certain percentage of the fair market value that is determined by local assessors to be the total taxable value of land and additions on the property. | Land | Improvement |
|---|---|---|---|---|
| 2025 | $3,736 | $231,032 | -- | -- |
| 2024 | $3,736 | $224,521 | -- | -- |
| 2023 | $3,656 | $213,846 | $0 | $0 |
| 2022 | $3,513 | $207,617 | $0 | $0 |
| 2021 | $3,504 | $201,570 | $0 | $0 |
| 2020 | $3,473 | $198,787 | $0 | $0 |
| 2019 | $3,421 | $194,318 | $0 | $0 |
| 2018 | $3,270 | $190,695 | $0 | $0 |
| 2017 | $3,247 | $186,773 | $0 | $0 |
| 2016 | $3,251 | $182,931 | $0 | $0 |
| 2015 | $3,331 | $181,659 | $0 | $0 |
| 2014 | $3,349 | $180,217 | $0 | $0 |
Source: Public Records
Map
Nearby Homes
- 4668 Wildewood Dr
- 4580 Oak Tree Ct
- 5100 Pineview Cir
- 4535 Oak Tree Ct
- 3314 Lowson Blvd
- 3537 Lakeview Dr
- 3313 Sherwood Blvd
- 800 Greensward Ct Unit 203I
- 800 Greensward Ct Unit 107I
- 634 Lakewoode Cir W
- 5212 Foxpointe Cir
- 730 Greensward Ct Unit 103J
- 730 Greensward Ct Unit 107J
- 624 Lakewoode Cir W
- 15708 Bottlebrush Cir
- 5085 Bottlebrush St
- 5055 Garfield Rd
- 900 Greensward Ln Unit 203G
- 830 Greensward Ct Unit 107H
- 900 Greensward Ln Unit 103G
- 3631 Lowson Blvd
- 3663 Lowson Blvd
- 3625 Lowson Blvd
- 3703 Lowson Blvd
- 3634 Lowson Blvd
- 3626 Lowson Blvd
- 4869 Pineview Cir
- 4865 Pineview Cir
- 3710 Lowson Blvd
- 3617 Lowson Blvd
- 3624 Lowson Blvd
- 3733 Lowson Blvd
- 4977 Pineview Cir
- 3605 Lowson Blvd
- 4872 Pineview Cir
- 3620 Lowson Blvd
- 3720 Lowson Blvd
- 3631 Sherwood Blvd
- 3617 Sherwood Blvd Unit B
- 3617 Sherwood Blvd