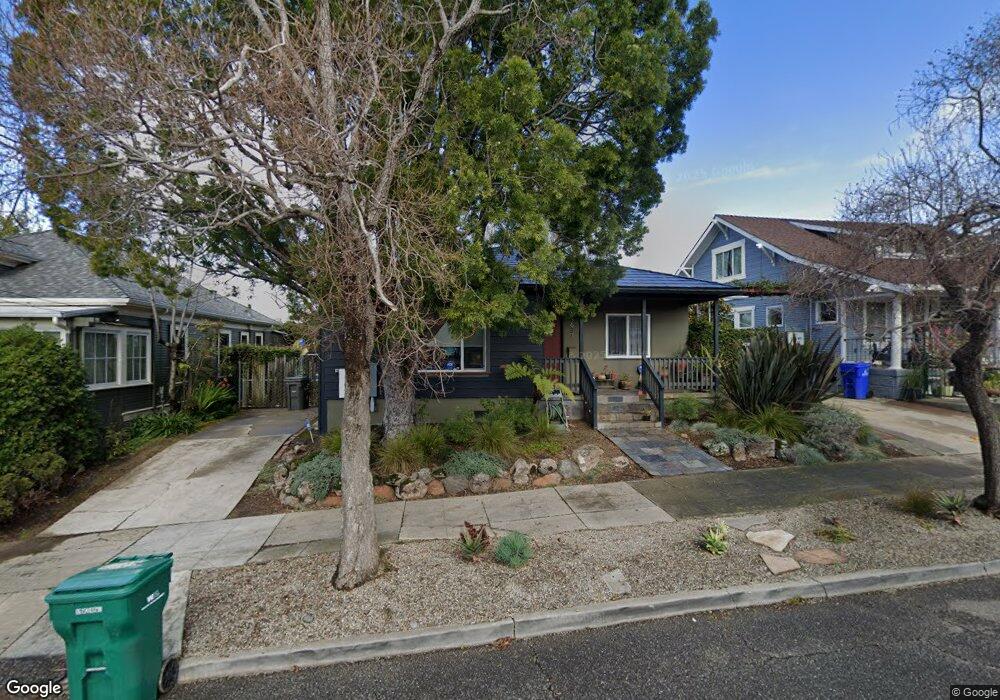
3637 Rhoda Ave Oakland, CA 94602
Dimond District NeighborhoodEstimated Value: $727,788 - $1,021,000
2
Beds
1
Bath
1,260
Sq Ft
$660/Sq Ft
Est. Value
About This Home
This home is located at 3637 Rhoda Ave, Oakland, CA 94602 and is currently estimated at $831,697, approximately $660 per square foot. 3637 Rhoda Ave is a home located in Alameda County with nearby schools including Sequoia Elementary School, Bret Harte Middle School, and Skyline High School.
Ownership History
Date
Name
Owned For
Owner Type
Purchase Details
Closed on
Sep 9, 2024
Sold by
Derek H Smith & Renee P Richard-Smith 20 and Smith Derek
Bought by
Smith Derek H
Current Estimated Value
Purchase Details
Closed on
Aug 8, 2024
Sold by
Smith Derek H
Bought by
Derek H Smith Trust and Smith
Purchase Details
Closed on
Jul 10, 2024
Sold by
Derek H Smith & Renee P Richard-Smith 20 and Smith Renee
Bought by
Smith Derek H
Purchase Details
Closed on
May 28, 2003
Sold by
Smith Derek
Bought by
Smith Derek H and Smith Renee P Richard
Purchase Details
Closed on
Jul 21, 1995
Sold by
Bain Jennifer J and Mew Michael K
Bought by
Smith Derek
Home Financials for this Owner
Home Financials are based on the most recent Mortgage that was taken out on this home.
Original Mortgage
$227,050
Interest Rate
7.62%
Create a Home Valuation Report for This Property
The Home Valuation Report is an in-depth analysis detailing your home's value as well as a comparison with similar homes in the area
Home Values in the Area
Average Home Value in this Area
Purchase History
| Date | Buyer | Sale Price | Title Company |
|---|---|---|---|
| Smith Derek H | -- | None Listed On Document | |
| Smith Derek H | -- | None Listed On Document | |
| Derek H Smith Trust | -- | None Listed On Document | |
| Derek H Smith Trust | -- | None Listed On Document | |
| Smith Derek H | -- | None Listed On Document | |
| Smith Derek H | -- | -- | |
| Smith Derek | $239,000 | Fidelity National Title Ins |
Source: Public Records
Mortgage History
| Date | Status | Borrower | Loan Amount |
|---|---|---|---|
| Previous Owner | Smith Derek | $227,050 |
Source: Public Records
Tax History Compared to Growth
Tax History
| Year | Tax Paid | Tax Assessment Tax Assessment Total Assessment is a certain percentage of the fair market value that is determined by local assessors to be the total taxable value of land and additions on the property. | Land | Improvement |
|---|---|---|---|---|
| 2025 | $6,837 | $397,017 | $119,105 | $277,912 |
| 2024 | $6,837 | $389,232 | $116,769 | $272,463 |
| 2023 | $7,110 | $381,601 | $114,480 | $267,121 |
| 2022 | $6,890 | $374,120 | $112,236 | $261,884 |
| 2021 | $6,524 | $366,785 | $110,035 | $256,750 |
| 2020 | $6,450 | $363,025 | $108,907 | $254,118 |
| 2019 | $6,167 | $355,908 | $106,772 | $249,136 |
| 2018 | $6,039 | $348,931 | $104,679 | $244,252 |
| 2017 | $5,793 | $342,091 | $102,627 | $239,464 |
| 2016 | $5,563 | $335,385 | $100,615 | $234,770 |
| 2015 | $5,531 | $330,350 | $99,105 | $231,245 |
| 2014 | $5,502 | $323,880 | $97,164 | $226,716 |
Source: Public Records
Map
Nearby Homes
- 2726 Madeline St
- 2715 Macarthur Blvd
- 3853 Rhoda Ave
- 3873 Coolidge Ave
- 3875 Coolidge Ave
- 3826 Lincoln Ave
- 2510 Delmer St
- 2941 Madeline St
- 3477 Boston Ave Unit 4
- 2958 Georgia St
- 2808 Carmel St
- 2954 Delaware St
- 3019 Florida St
- 3316 Coolidge Ave
- 3464 Champion St
- 2240 Macarthur Blvd
- 3887 Forest Hill Ave
- 3055 Kansas St
- 4019 Rhoda Ave
- 3645 Rhoda Ave
- 3631 Rhoda Ave
- 3653 Rhoda Ave
- 3621 Rhoda Ave
- 3638 Laguna Ave
- 3700 Laguna Ave
- 3624 Laguna Ave
- 3708 Laguna Ave
- 3616 Laguna Ave
- 3703 Rhoda Ave
- 3615 Rhoda Ave
- 3615 Rhoda Ave Unit 2
- 3615 Rhoda Ave Unit 3
- 3615 Rhoda Ave Unit 1
- 3615 Rhoda Ave Unit 4
- 3636 Rhoda Ave
- 3714 Laguna Ave
- 3626 Rhoda Ave
- 3646 Rhoda Ave
- 3604 Laguna Ave