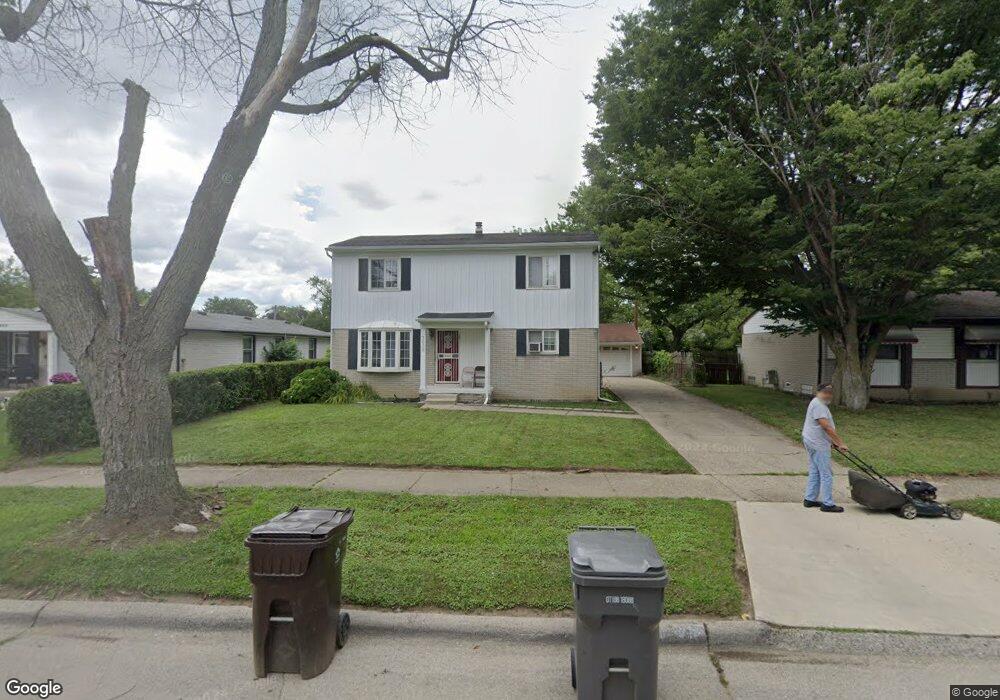
3638 Farnum St Unit Bldg-Unit Inkster, MI 48141
Estimated Value: $117,000 - $168,000
--
Bed
1
Bath
1,366
Sq Ft
$106/Sq Ft
Est. Value
About This Home
This home is located at 3638 Farnum St Unit Bldg-Unit, Inkster, MI 48141 and is currently estimated at $144,263, approximately $105 per square foot. 3638 Farnum St Unit Bldg-Unit is a home located in Wayne County with nearby schools including Romulus Elementary School, Romulus Middle School, and Romulus Senior High School.
Ownership History
Date
Name
Owned For
Owner Type
Purchase Details
Closed on
Jan 2, 2025
Sold by
Thornton Willie
Bought by
White John D
Current Estimated Value
Purchase Details
Closed on
Jul 15, 2024
Sold by
Progressive Real Estate Llc
Bought by
Thornton Willie
Purchase Details
Closed on
Jul 18, 2018
Sold by
Progressive Real Estate Llc
Bought by
Thornton Willie
Purchase Details
Closed on
Aug 31, 2017
Sold by
City Of Inkster
Bought by
Progressive Real Estate Llc
Purchase Details
Closed on
Aug 21, 2017
Sold by
Sabree Eric R
Bought by
Treasure Controller City Of Inkster
Purchase Details
Closed on
May 3, 2013
Sold by
Destiny Financial Services Inc
Bought by
King Of Kings International
Purchase Details
Closed on
Nov 18, 2011
Sold by
Wojtowicz Raymond J
Bought by
Destiny Financial Services Inc
Create a Home Valuation Report for This Property
The Home Valuation Report is an in-depth analysis detailing your home's value as well as a comparison with similar homes in the area
Home Values in the Area
Average Home Value in this Area
Purchase History
| Date | Buyer | Sale Price | Title Company |
|---|---|---|---|
| White John D | $102 | None Listed On Document | |
| Thornton Willie | $80,000 | None Listed On Document | |
| Thornton Willie | -- | None Available | |
| Progressive Real Estate Llc | -- | None Available | |
| Progressive Real Estate Llc | -- | None Available | |
| Treasure Controller City Of Inkster | $5,233 | None Available | |
| King Of Kings International | $3,300 | None Available | |
| Destiny Financial Services Inc | $3,300 | None Available |
Source: Public Records
Mortgage History
| Date | Status | Borrower | Loan Amount |
|---|---|---|---|
| Closed | Thornton Willie | $0 |
Source: Public Records
Tax History Compared to Growth
Tax History
| Year | Tax Paid | Tax Assessment Tax Assessment Total Assessment is a certain percentage of the fair market value that is determined by local assessors to be the total taxable value of land and additions on the property. | Land | Improvement |
|---|---|---|---|---|
| 2025 | $2,016 | $71,000 | $0 | $0 |
| 2024 | $2,016 | $52,600 | $0 | $0 |
| 2023 | $1,642 | $41,800 | $0 | $0 |
| 2022 | $2,313 | $34,400 | $0 | $0 |
| 2021 | $2,401 | $30,700 | $0 | $0 |
| 2020 | $2,354 | $26,900 | $0 | $0 |
| 2019 | $2,352 | $22,900 | $0 | $0 |
| 2018 | $1,364 | $19,700 | $0 | $0 |
| 2017 | $1,117 | $19,200 | $0 | $0 |
| 2016 | $1,840 | $17,300 | $0 | $0 |
| 2015 | $2,130 | $21,300 | $0 | $0 |
| 2013 | $2,990 | $29,900 | $0 | $0 |
| 2012 | $1,490 | $33,900 | $3,200 | $30,700 |
Source: Public Records
Map
Nearby Homes
- 29978 Carlysle St
- 4056 Fox St
- 29600 Pine St
- Vacant Wayland Ct
- 3616 Spring Hill Ave
- 3726 Isabelle St
- 29038 York St
- 29026 York St
- 3235 Isabelle St
- 29119 York St
- 4080 Isabelle St
- 28870 Annapolis Ave Unit 16
- 4705 S Middlebelt Rd
- 4315 Isabelle St
- 28222 Carlysle St
- 3146 Walnut St
- 29006 Eton St
- 2390 Spring Hill Ave
- 4770 Matthew St
- 3155 Walnut St