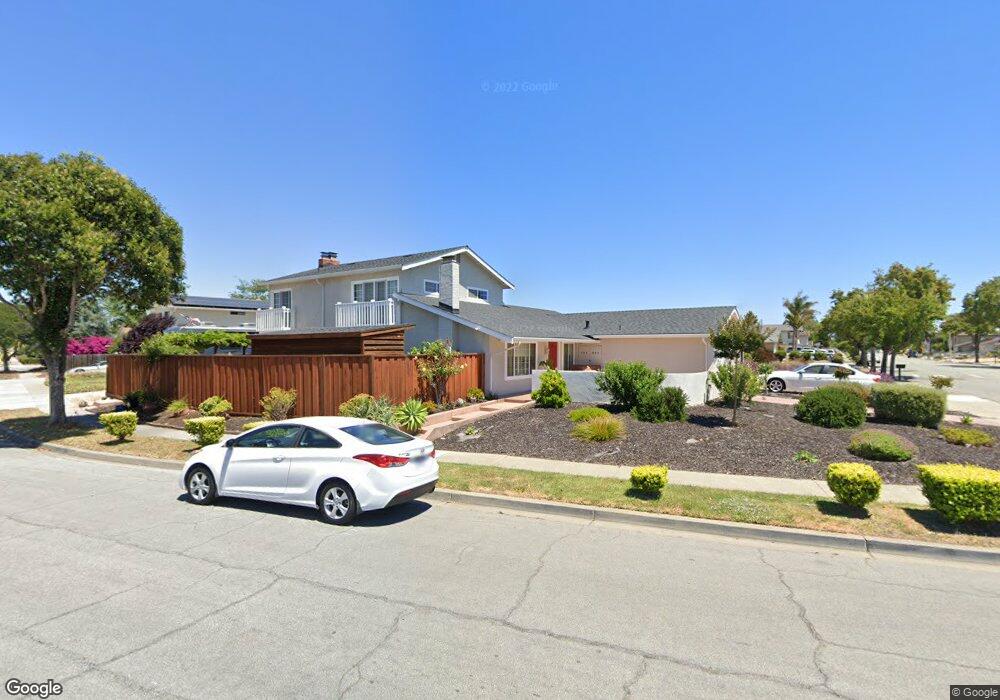
36388 Spruce St Newark, CA 94560
Estimated Value: $1,576,000 - $1,784,000
6
Beds
3
Baths
2,757
Sq Ft
$609/Sq Ft
Est. Value
About This Home
This home is located at 36388 Spruce St, Newark, CA 94560 and is currently estimated at $1,678,261, approximately $608 per square foot. 36388 Spruce St is a home located in Alameda County with nearby schools including Lincoln Elementary School, Newark Junior High School, and Newark Memorial High School.
Ownership History
Date
Name
Owned For
Owner Type
Purchase Details
Closed on
Oct 8, 2022
Sold by
Arteaga Jacinta
Bought by
Jacinta Arteaga Living Trust
Current Estimated Value
Purchase Details
Closed on
Nov 12, 2015
Sold by
Savoni Patrick R
Bought by
Arteaga Jacinta
Purchase Details
Closed on
Feb 24, 2015
Sold by
Bernard Clifford J
Bought by
Arteaga Jacinta and Savoni Patrick R
Home Financials for this Owner
Home Financials are based on the most recent Mortgage that was taken out on this home.
Original Mortgage
$625,500
Interest Rate
4.01%
Mortgage Type
New Conventional
Purchase Details
Closed on
Mar 15, 2001
Sold by
Bernard Cinderella M
Bought by
Bernard Clifton J
Home Financials for this Owner
Home Financials are based on the most recent Mortgage that was taken out on this home.
Original Mortgage
$393,750
Interest Rate
6.97%
Mortgage Type
Stand Alone First
Create a Home Valuation Report for This Property
The Home Valuation Report is an in-depth analysis detailing your home's value as well as a comparison with similar homes in the area
Home Values in the Area
Average Home Value in this Area
Purchase History
| Date | Buyer | Sale Price | Title Company |
|---|---|---|---|
| Jacinta Arteaga Living Trust | -- | -- | |
| Arteaga Jacinta | -- | None Available | |
| Arteaga Jacinta | -- | Accommodation | |
| Arteaga Jacinta | $850,000 | Chicago Title Company | |
| Bernard Clifton J | -- | -- |
Source: Public Records
Mortgage History
| Date | Status | Borrower | Loan Amount |
|---|---|---|---|
| Previous Owner | Arteaga Jacinta | $625,500 | |
| Previous Owner | Bernard Clifton J | $393,750 |
Source: Public Records
Tax History
| Year | Tax Paid | Tax Assessment Tax Assessment Total Assessment is a certain percentage of the fair market value that is determined by local assessors to be the total taxable value of land and additions on the property. | Land | Improvement |
|---|---|---|---|---|
| 2025 | $12,054 | $999,008 | $301,742 | $704,266 |
| 2024 | $12,054 | $979,283 | $295,826 | $690,457 |
| 2023 | $11,737 | $966,950 | $290,027 | $676,923 |
| 2022 | $11,602 | $940,990 | $284,340 | $663,650 |
| 2021 | $11,308 | $922,404 | $278,766 | $650,638 |
| 2020 | $11,200 | $919,877 | $275,908 | $643,969 |
| 2019 | $11,036 | $901,844 | $270,499 | $631,345 |
| 2018 | $10,875 | $884,167 | $265,197 | $618,970 |
| 2017 | $10,598 | $866,831 | $259,998 | $606,833 |
| 2016 | $10,517 | $849,835 | $254,900 | $594,935 |
| 2015 | $2,380 | $163,753 | $44,198 | $119,555 |
| 2014 | $2,309 | $160,546 | $43,332 | $117,214 |
Source: Public Records
Map
Nearby Homes
- 8106 Pebble Beach Ave
- 7728 Hazelnut Dr
- 7482 Birkdale Dr
- 36184 Toulouse St
- 36075 Crystal Springs Dr
- 36063 Crystal Springs Dr
- 36563 Beutke Dr
- 7843 Railroad Ave
- 6417/6433 Thornton Ave
- 6449 Cedar Blvd
- 6328 Zulmida Ave
- 6364 Noel Ave
- 37119 Hickory St
- 37471 Bay Crest Rd
- 37541 Bay Crest Rd
- 37532 Bay Crest Rd
- 37515 Sea Bank St
- 9263 Vista Cove Way
- 37221 Salt Pond Place
- 37029 Olive St
- 36410 Spruce St
- 7978 Shorehaven Ave
- 36422 Spruce St
- 8037 Shorehaven Ave
- 36403 Spruce St
- 36331 Shorehaven Place
- 8013 Shorehaven Ave
- 36391 Spruce St
- 36311 Shorehaven Place
- 7989 Shorehaven Ave
- 36425 Spruce St
- 36379 Spruce St
- 36353 Shorehaven Place
- 7963 Shorehaven Ave
- 36434 Spruce St
- 36437 Spruce St
- 8102 Idlewild Ct
- 36365 Spruce St
- 8042 Par Ct
- 8064 Par Ct
Your Personal Tour Guide
Ask me questions while you tour the home.