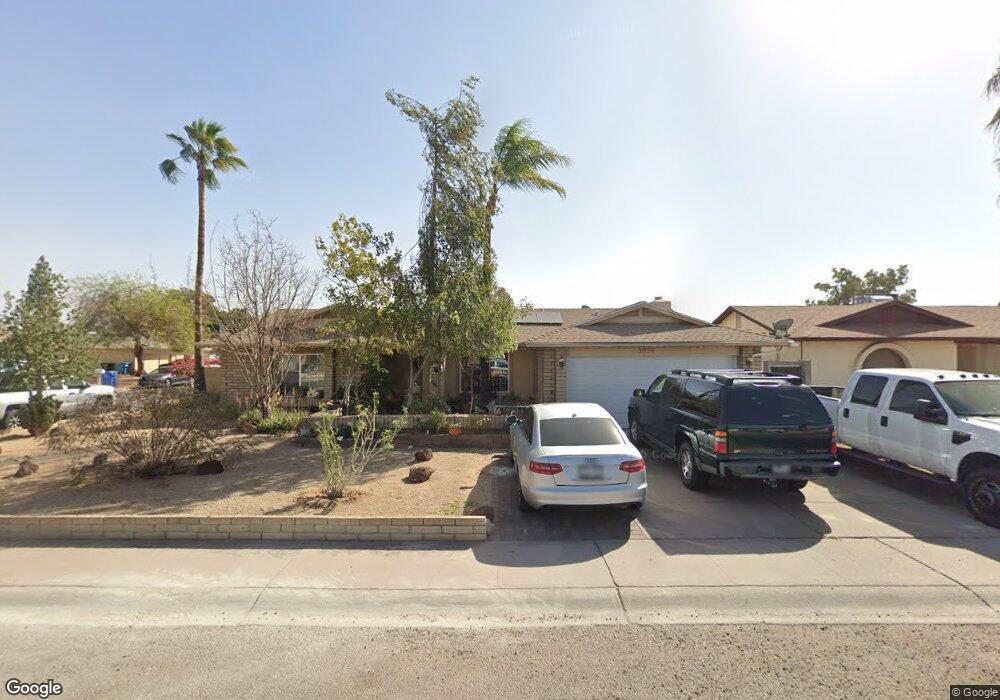
3639 W Pershing Ave Phoenix, AZ 85029
North Mountain Village NeighborhoodEstimated Value: $386,719 - $478,000
3
Beds
2
Baths
2,048
Sq Ft
$213/Sq Ft
Est. Value
About This Home
This home is located at 3639 W Pershing Ave, Phoenix, AZ 85029 and is currently estimated at $435,680, approximately $212 per square foot. 3639 W Pershing Ave is a home located in Maricopa County with nearby schools including Chaparral Elementary School, Desert Foothills Middle School, and Moon Valley High School.
Ownership History
Date
Name
Owned For
Owner Type
Purchase Details
Closed on
May 3, 2006
Sold by
Sanchez Jose B
Bought by
Sanchez Jose B and Sanchez Maria
Current Estimated Value
Home Financials for this Owner
Home Financials are based on the most recent Mortgage that was taken out on this home.
Original Mortgage
$236,800
Outstanding Balance
$98,711
Interest Rate
1.75%
Mortgage Type
Negative Amortization
Estimated Equity
$336,969
Purchase Details
Closed on
Nov 26, 2003
Sold by
Sanchez Maria
Bought by
Sanchez Jose B
Home Financials for this Owner
Home Financials are based on the most recent Mortgage that was taken out on this home.
Original Mortgage
$155,325
Interest Rate
6.04%
Mortgage Type
Purchase Money Mortgage
Purchase Details
Closed on
Nov 25, 2003
Sold by
Mccray C Annabel and Ward Anita
Bought by
Sanchez Jose B
Home Financials for this Owner
Home Financials are based on the most recent Mortgage that was taken out on this home.
Original Mortgage
$155,325
Interest Rate
6.04%
Mortgage Type
Purchase Money Mortgage
Create a Home Valuation Report for This Property
The Home Valuation Report is an in-depth analysis detailing your home's value as well as a comparison with similar homes in the area
Home Values in the Area
Average Home Value in this Area
Purchase History
| Date | Buyer | Sale Price | Title Company |
|---|---|---|---|
| Sanchez Jose B | -- | Fidelity National Title | |
| Sanchez Jose B | -- | Century Title Agency Inc | |
| Sanchez Jose B | $163,500 | Century Title Agency Inc |
Source: Public Records
Mortgage History
| Date | Status | Borrower | Loan Amount |
|---|---|---|---|
| Open | Sanchez Jose B | $236,800 | |
| Closed | Sanchez Jose B | $155,325 | |
| Closed | Sanchez Jose B | $155,325 |
Source: Public Records
Tax History Compared to Growth
Tax History
| Year | Tax Paid | Tax Assessment Tax Assessment Total Assessment is a certain percentage of the fair market value that is determined by local assessors to be the total taxable value of land and additions on the property. | Land | Improvement |
|---|---|---|---|---|
| 2025 | $1,892 | $16,970 | -- | -- |
| 2024 | $1,783 | $16,162 | -- | -- |
| 2023 | $1,783 | $33,550 | $6,710 | $26,840 |
| 2022 | $1,720 | $26,000 | $5,200 | $20,800 |
| 2021 | $1,764 | $23,760 | $4,750 | $19,010 |
| 2020 | $1,716 | $22,250 | $4,450 | $17,800 |
| 2019 | $1,685 | $21,480 | $4,290 | $17,190 |
| 2018 | $1,637 | $19,910 | $3,980 | $15,930 |
| 2017 | $1,633 | $17,280 | $3,450 | $13,830 |
| 2016 | $1,603 | $16,710 | $3,340 | $13,370 |
| 2015 | $1,487 | $16,380 | $3,270 | $13,110 |
Source: Public Records
Map
Nearby Homes
- 3765 W Wood Dr
- 12813 N 36th Dr
- 3410 W Pershing Ave
- 3432 W Joan de Arc Ave
- 3809 W Rue de Lamour Ave Unit 2
- 13801 N 37th Ave
- 13801 N 36th Dr
- 3349 W Surrey Ave
- 12455 N Columbine Dr
- 3916 W Wood Dr
- 3341 W Pershing Ave
- 3937 W Wood Dr Unit 2
- 3320 W Windrose Dr
- 3944 W Wood Dr
- 3724 W Bloomfield Rd
- 3313 W Surrey Ave
- 3734 W Dailey St
- 14014 N 39th Ave
- 3207 W Joan de Arc Ave
- 3708 W Redfield Rd
- 3645 W Pershing Ave
- 3649 W Pershing Ave
- 13025 N 36th Dr
- 13031 N 36th Dr
- 3640 W Pershing Ave
- 13019 N 36th Dr
- 3646 W Pershing Ave
- 3636 W Pershing Ave
- 13020 N 37th Ave
- 3650 W Sweetwater Ave
- 3650 W Sweetwater Ave
- 13037 N 36th Dr
- 13013 N 36th Dr
- 13036 N 37th Ave
- 13040 N 37th Ave
- 3569 W Pershing Ave
- 13016 N 37th Ave
- 3633 W Andora Dr
- 3633 W Andorra Dr
- 13007 N 36th Dr Unit 2