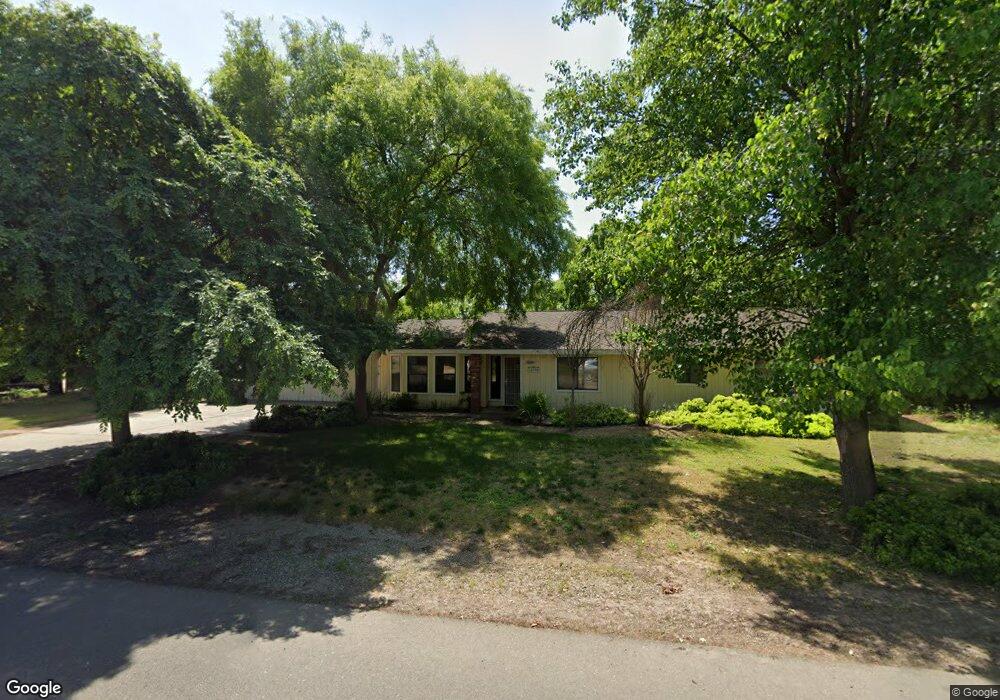
36390 Cloverleaf Ave Madera, CA 93636
Estimated Value: $431,106 - $498,000
3
Beds
2
Baths
1,622
Sq Ft
$288/Sq Ft
Est. Value
About This Home
This home is located at 36390 Cloverleaf Ave, Madera, CA 93636 and is currently estimated at $467,277, approximately $288 per square foot. 36390 Cloverleaf Ave is a home located in Madera County with nearby schools including Webster Elementary School, Ranchos Middle School, and Liberty High School.
Ownership History
Date
Name
Owned For
Owner Type
Purchase Details
Closed on
Dec 13, 2016
Sold by
Coffey Heather D and Coffey William E
Bought by
Coffey Heather D
Current Estimated Value
Home Financials for this Owner
Home Financials are based on the most recent Mortgage that was taken out on this home.
Original Mortgage
$118,000
Interest Rate
4.03%
Mortgage Type
New Conventional
Purchase Details
Closed on
Aug 9, 2010
Sold by
Coffey Heather D
Bought by
Coffey Heather D and Coffey William E
Home Financials for this Owner
Home Financials are based on the most recent Mortgage that was taken out on this home.
Original Mortgage
$126,000
Interest Rate
4.52%
Mortgage Type
New Conventional
Purchase Details
Closed on
Jun 15, 2004
Sold by
Coffey William E
Bought by
Coffey Heather D
Home Financials for this Owner
Home Financials are based on the most recent Mortgage that was taken out on this home.
Original Mortgage
$104,000
Interest Rate
6.27%
Mortgage Type
New Conventional
Create a Home Valuation Report for This Property
The Home Valuation Report is an in-depth analysis detailing your home's value as well as a comparison with similar homes in the area
Home Values in the Area
Average Home Value in this Area
Purchase History
| Date | Buyer | Sale Price | Title Company |
|---|---|---|---|
| Coffey Heather D | -- | Chicago Title Company | |
| Coffey Heather D | -- | First American Title Company | |
| Coffey Heather D | -- | Stewart | |
| Coffey Heather D | -- | Stewart |
Source: Public Records
Mortgage History
| Date | Status | Borrower | Loan Amount |
|---|---|---|---|
| Closed | Coffey Heather D | $118,000 | |
| Closed | Coffey Heather D | $126,000 | |
| Closed | Coffey Heather D | $104,000 |
Source: Public Records
Tax History
| Year | Tax Paid | Tax Assessment Tax Assessment Total Assessment is a certain percentage of the fair market value that is determined by local assessors to be the total taxable value of land and additions on the property. | Land | Improvement |
|---|---|---|---|---|
| 2025 | $3,198 | $198,026 | $53,038 | $144,988 |
| 2023 | $3,198 | $190,339 | $50,980 | $139,359 |
| 2022 | $2,112 | $186,608 | $49,981 | $136,627 |
| 2021 | $2,873 | $182,950 | $49,001 | $133,949 |
| 2020 | $2,861 | $181,075 | $48,499 | $132,576 |
| 2019 | $2,719 | $177,526 | $47,549 | $129,977 |
| 2018 | $2,569 | $174,046 | $46,617 | $127,429 |
| 2017 | $2,101 | $170,634 | $45,703 | $124,931 |
| 2016 | $1,941 | $167,289 | $44,807 | $122,482 |
| 2015 | $1,940 | $164,777 | $44,134 | $120,643 |
| 2014 | $2,500 | $161,550 | $43,270 | $118,280 |
Source: Public Records
Map
Nearby Homes
- 849 Livio Way
- 36308 Marciel Ave
- 36313 Avenue 12
- 36620 Avenue 12
- 11850 Topper Rd
- 36752 Avenue 13
- 920 Ponderosa Way W
- 37206 Avenue 12
- 37249 Avenue 12
- 37303 Berkshire Dr
- 37367 Marciel Ave
- 12629 Bronco Rd
- 35242 Mustang Ln
- 588 Overstone Ave
- 642 Stone Crest Ave
- 649 Wood Crest Ave
- 673 Redrock Dr
- 4593 Orchard Hills Rd
- 944 Horizon Dr
- 835 Fir St W
- 12336 Cranberry Rd
- 36354 Cloverleaf Ave
- 36393 Cloverleaf Ave
- 12337 Waverly Rd
- 12314 Cranberry Rd
- 36371 Cloverleaf Ave
- 36415 Cloverleaf Ave
- 36438 Cloverleaf Ave
- 12337 Cranberry Rd
- 12315 Waverly Rd
- 12399 Waverly Rd
- 36439 Cloverleaf Ave
- 12315 Cranberry Rd
- 12294 Cranberry Rd
- 12293 Waverly Rd
- 36394 Ruth Ave
- 36461 Cloverleaf Ave
- 36372 Ruth Ave
- 12293 Cranberry Rd
- 36416 Ruth Ave
Your Personal Tour Guide
Ask me questions while you tour the home.