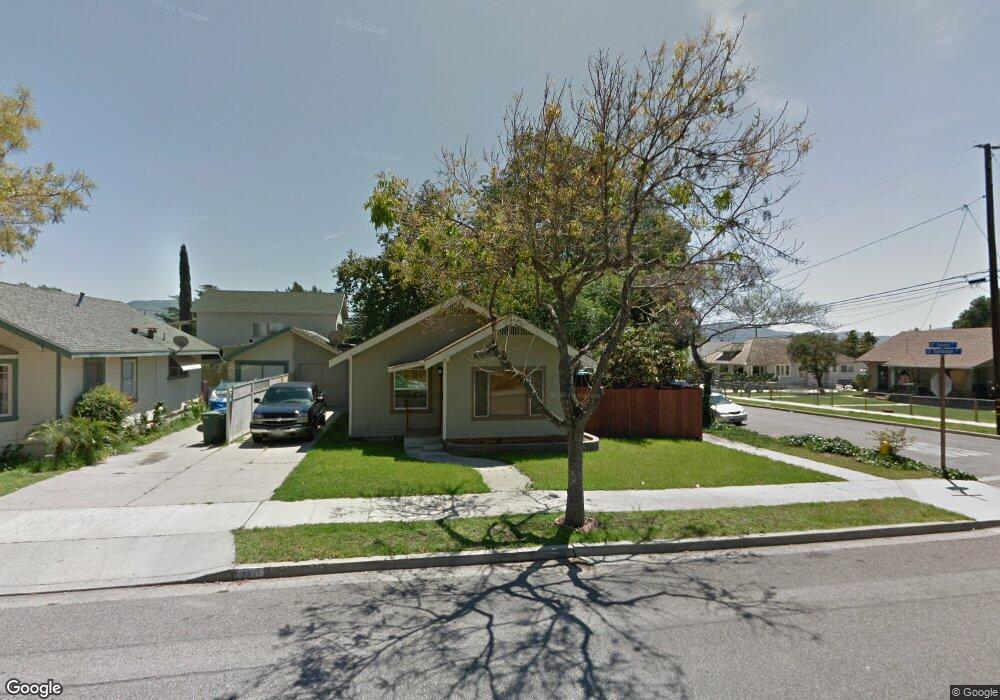
364 2nd St Fillmore, CA 93015
Estimated Value: $435,000 - $486,000
2
Beds
1
Bath
822
Sq Ft
$562/Sq Ft
Est. Value
About This Home
This home is located at 364 2nd St, Fillmore, CA 93015 and is currently estimated at $462,056, approximately $562 per square foot. 364 2nd St is a home located in Ventura County with nearby schools including San Cayetano Elementary School and Fillmore Senior High.
Ownership History
Date
Name
Owned For
Owner Type
Purchase Details
Closed on
Jul 20, 2011
Sold by
Federal Home Loan Mortgage Corporation
Bought by
Elizarraraz Gilberto and Elizarraraz Connie M
Current Estimated Value
Home Financials for this Owner
Home Financials are based on the most recent Mortgage that was taken out on this home.
Original Mortgage
$118,400
Outstanding Balance
$81,263
Interest Rate
4.46%
Mortgage Type
New Conventional
Estimated Equity
$380,793
Purchase Details
Closed on
Mar 29, 2011
Sold by
Jimenez Juan V and Jimenez Margarita
Bought by
Federal Home Loan Mortgage Corporation
Purchase Details
Closed on
Sep 24, 1999
Sold by
Jimenez Juan V and Jimenez Margarita
Bought by
Jimenez Juan and Jimenez Margarita
Purchase Details
Closed on
Jun 29, 1999
Sold by
Azlin Troy M Bonnie J
Bought by
Jimenez Juan V and Jimenez Margarita C
Home Financials for this Owner
Home Financials are based on the most recent Mortgage that was taken out on this home.
Original Mortgage
$128,142
Interest Rate
7.4%
Mortgage Type
FHA
Create a Home Valuation Report for This Property
The Home Valuation Report is an in-depth analysis detailing your home's value as well as a comparison with similar homes in the area
Home Values in the Area
Average Home Value in this Area
Purchase History
| Date | Buyer | Sale Price | Title Company |
|---|---|---|---|
| Elizarraraz Gilberto | $148,000 | First American Title Co | |
| Federal Home Loan Mortgage Corporation | $153,000 | Accommodation | |
| Jimenez Juan | -- | -- | |
| Jimenez Juan V | $129,000 | First American Title Ins Co |
Source: Public Records
Mortgage History
| Date | Status | Borrower | Loan Amount |
|---|---|---|---|
| Open | Elizarraraz Gilberto | $118,400 | |
| Previous Owner | Jimenez Juan V | $128,142 | |
| Closed | Jimenez Juan V | $6,450 |
Source: Public Records
Tax History Compared to Growth
Tax History
| Year | Tax Paid | Tax Assessment Tax Assessment Total Assessment is a certain percentage of the fair market value that is determined by local assessors to be the total taxable value of land and additions on the property. | Land | Improvement |
|---|---|---|---|---|
| 2025 | $2,124 | $189,601 | $117,863 | $71,738 |
| 2024 | $2,124 | $185,884 | $115,552 | $70,332 |
| 2023 | $2,095 | $182,240 | $113,287 | $68,953 |
| 2022 | $1,939 | $178,667 | $111,066 | $67,601 |
| 2021 | $2,203 | $175,164 | $108,888 | $66,276 |
| 2020 | $2,045 | $173,370 | $107,772 | $65,598 |
| 2019 | $2,051 | $169,971 | $105,659 | $64,312 |
| 2018 | $2,010 | $166,639 | $103,588 | $63,051 |
| 2017 | $2,021 | $163,372 | $101,557 | $61,815 |
| 2016 | $1,873 | $160,169 | $99,566 | $60,603 |
| 2015 | $1,822 | $157,765 | $98,071 | $59,694 |
| 2014 | $1,820 | $154,676 | $96,150 | $58,526 |
Source: Public Records
Map
Nearby Homes
- 639 Mountain View St
- 0 Fillmore St
- 404 Central Ave
- 340 Central Ave
- 330 Buttercup St
- 809 Woodgrove Rd
- 815 Woodgrove Rd
- 199 Rosewood St
- 81 Wildwood Ln
- 309 Heritage Valley Pkwy
- 513 Heritage Valley Pkwy
- 949 Blaine Ave
- 250 E Telegraph Rd #30 Rd Unit 30
- 915 E Telegraph Rd
- 954 Taylor Ln
- 250 E Telegraph Rd Unit 68
- 250 E Telegraph Rd Unit 135
- 250 E Telegraph Rd Unit 213
- 250 E Telegraph Rd Unit 224
- 250 E Telegraph Rd Unit 184