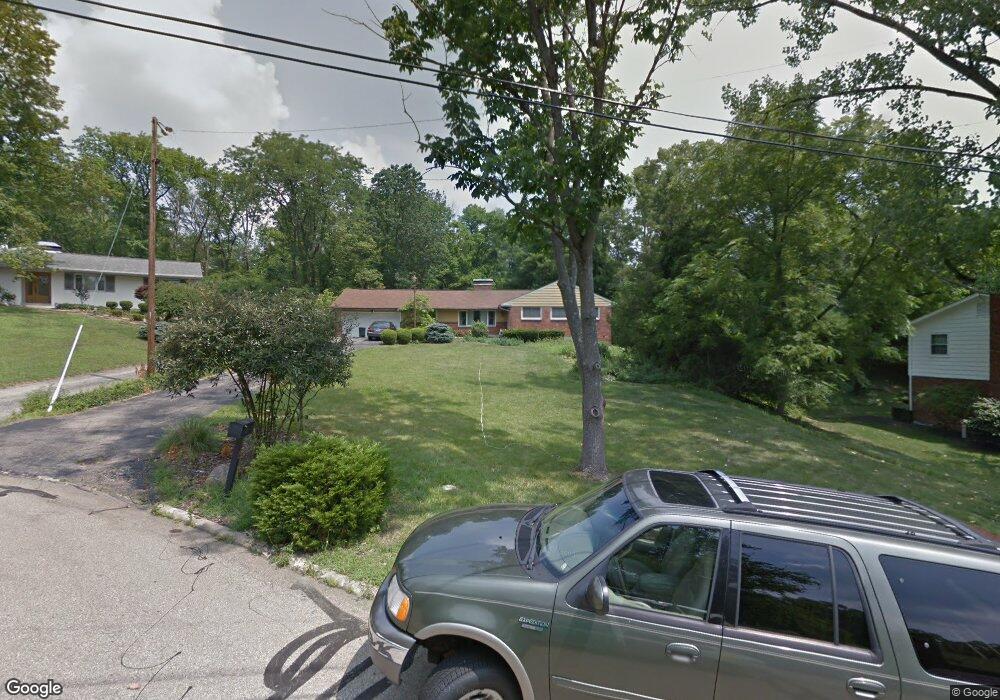
364 Brocdorf Dr Cincinnati, OH 45215
Estimated Value: $601,000 - $767,000
3
Beds
3
Baths
2,481
Sq Ft
$275/Sq Ft
Est. Value
About This Home
This home is located at 364 Brocdorf Dr, Cincinnati, OH 45215 and is currently estimated at $681,374, approximately $274 per square foot. 364 Brocdorf Dr is a home located in Hamilton County with nearby schools including Wyoming High School.
Ownership History
Date
Name
Owned For
Owner Type
Purchase Details
Closed on
May 10, 2005
Sold by
Bunger Amy B
Bought by
Abouamara Iyad A and Denton Stephanie R
Current Estimated Value
Home Financials for this Owner
Home Financials are based on the most recent Mortgage that was taken out on this home.
Original Mortgage
$293,600
Outstanding Balance
$151,943
Interest Rate
6.13%
Mortgage Type
Fannie Mae Freddie Mac
Estimated Equity
$529,431
Purchase Details
Closed on
Jul 16, 2004
Sold by
Young Eric A and Young Maryetta Z
Bought by
Bunger Amy B
Home Financials for this Owner
Home Financials are based on the most recent Mortgage that was taken out on this home.
Original Mortgage
$270,000
Interest Rate
6.42%
Mortgage Type
Fannie Mae Freddie Mac
Purchase Details
Closed on
Jan 15, 1998
Sold by
Young Eric A
Bought by
Young Eric A
Purchase Details
Closed on
Sep 21, 1994
Sold by
Young Eric A and Young Maryetta Z
Bought by
Young Eric A and Young Maryetta Z
Create a Home Valuation Report for This Property
The Home Valuation Report is an in-depth analysis detailing your home's value as well as a comparison with similar homes in the area
Home Values in the Area
Average Home Value in this Area
Purchase History
| Date | Buyer | Sale Price | Title Company |
|---|---|---|---|
| Abouamara Iyad A | -- | Fidelity Land Title Agency O | |
| Bunger Amy B | $337,500 | -- | |
| Young Eric A | -- | -- | |
| Young Maryetta Z | -- | -- | |
| Young Eric A | -- | -- | |
| Young Eric A | -- | -- |
Source: Public Records
Mortgage History
| Date | Status | Borrower | Loan Amount |
|---|---|---|---|
| Open | Abouamara Iyad A | $293,600 | |
| Closed | Bunger Amy B | $270,000 |
Source: Public Records
Tax History
| Year | Tax Paid | Tax Assessment Tax Assessment Total Assessment is a certain percentage of the fair market value that is determined by local assessors to be the total taxable value of land and additions on the property. | Land | Improvement |
|---|---|---|---|---|
| 2025 | $10,620 | $170,363 | $25,697 | $144,666 |
| 2024 | $10,620 | $170,363 | $25,697 | $144,666 |
| 2023 | $9,679 | $170,363 | $25,697 | $144,666 |
| 2022 | $8,649 | $123,407 | $27,241 | $96,166 |
| 2021 | $8,601 | $123,407 | $27,241 | $96,166 |
| 2020 | $8,580 | $123,407 | $27,241 | $96,166 |
| 2019 | $8,797 | $116,421 | $25,697 | $90,724 |
| 2018 | $8,795 | $116,421 | $25,697 | $90,724 |
| 2017 | $8,536 | $116,421 | $25,697 | $90,724 |
| 2016 | $7,369 | $113,915 | $24,395 | $89,520 |
| 2015 | $7,338 | $113,915 | $24,395 | $89,520 |
| 2014 | $6,996 | $113,915 | $24,395 | $89,520 |
| 2013 | $6,585 | $102,624 | $21,977 | $80,647 |
Source: Public Records
Map
Nearby Homes
- 377 Compton Rd
- 204 Brocdorf Dr
- 271 Poage Farm Rd
- 269 Compton Rd
- 513 Chisholm Trail
- 163 Compton Rd
- 416 Flemridge Ct
- 320 Reily Rd
- 8415 Mayfair St
- 9197 Long Ln
- 25 Euclid Ave
- 8768 Cavalier Dr
- 9469 Beech Dr
- 704 W Galbraith Rd
- 712 W Galbraith Rd
- 26 W Mills Ave
- 8318 Marley St
- 343 Ashley Ln
- 816 Sabino Ct
- 177 Burns Ave
- 368 Brocdorf Dr
- 360 Brocdorf Dr
- 308 Ardon Ln
- 372 Brocdorf Dr
- 312 Ardon Ln
- 373 Compton Rd
- 365 Brocdorf Dr
- 369 Brocdorf Dr
- 365 Compton Rd
- 359 Brocdorf Dr
- 316 Ardon Ln
- 305 Ardon Ln
- 371 Compton Rd
- 287 Compton Ridge Dr
- 237 Brocdorf Dr
- 302 Compton Hills Dr
- 320 Ardon Ln
- 369 Compton Rd
- 288 Compton Ridge Dr
- 310 Compton Hills Dr
Your Personal Tour Guide
Ask me questions while you tour the home.