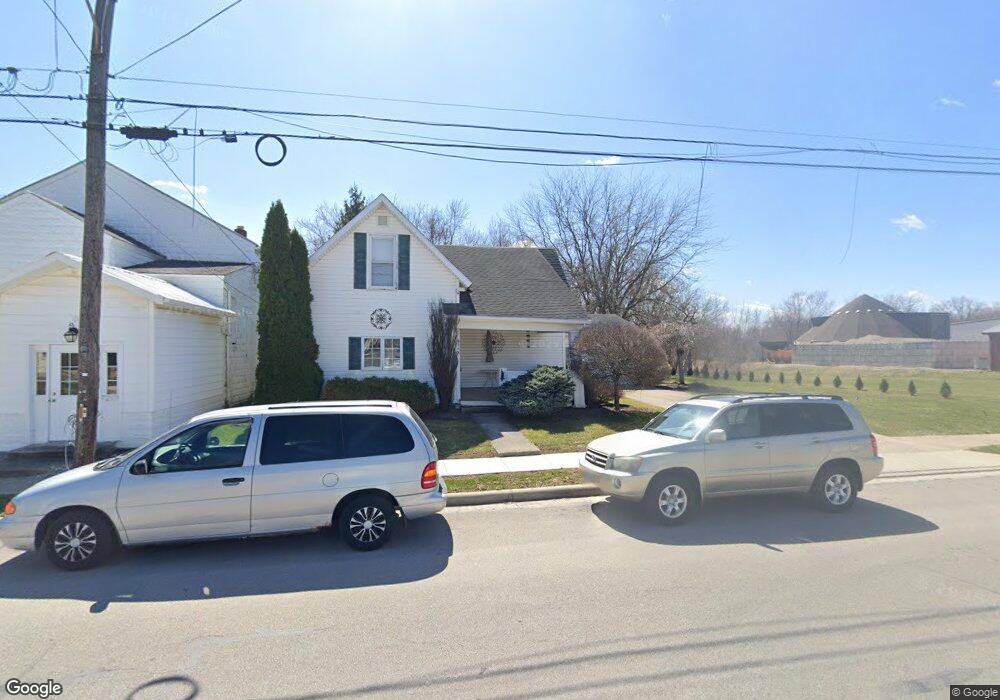
364 E 2nd St Unit STTM50 Ottawa, OH 45875
Estimated Value: $144,000 - $171,000
3
Beds
1
Bath
1,568
Sq Ft
$103/Sq Ft
Est. Value
About This Home
This home is located at 364 E 2nd St Unit STTM50, Ottawa, OH 45875 and is currently estimated at $161,384, approximately $102 per square foot. 364 E 2nd St Unit STTM50 is a home located in Putnam County with nearby schools including Ottawa-Glandorf High School and Sts. Peter & Paul Catholic School.
Ownership History
Date
Name
Owned For
Owner Type
Purchase Details
Closed on
Mar 11, 2020
Sold by
Northwest Home Improvement Llc
Bought by
Collins John J
Current Estimated Value
Home Financials for this Owner
Home Financials are based on the most recent Mortgage that was taken out on this home.
Original Mortgage
$70,000
Outstanding Balance
$61,334
Interest Rate
3.4%
Mortgage Type
Future Advance Clause Open End Mortgage
Estimated Equity
$100,050
Purchase Details
Closed on
Jan 4, 2008
Sold by
Nienberg Patricia L
Bought by
Northwest Home Improvement Llc
Purchase Details
Closed on
Sep 12, 2007
Sold by
Nienberg Patricia L and Nienberg Family Trust
Bought by
Nienberg Patricia L
Purchase Details
Closed on
Jan 2, 2004
Bought by
Nienberg Daniel J and Nienberg Patr
Purchase Details
Closed on
Jul 8, 2001
Bought by
Northwest Home Improveme
Create a Home Valuation Report for This Property
The Home Valuation Report is an in-depth analysis detailing your home's value as well as a comparison with similar homes in the area
Home Values in the Area
Average Home Value in this Area
Purchase History
| Date | Buyer | Sale Price | Title Company |
|---|---|---|---|
| Collins John J | $70,000 | None Available | |
| Northwest Home Improvement Llc | $31,500 | None Available | |
| Nienberg Patricia L | -- | None Available | |
| Nienberg Daniel J | -- | -- | |
| Northwest Home Improveme | $31,500 | -- |
Source: Public Records
Mortgage History
| Date | Status | Borrower | Loan Amount |
|---|---|---|---|
| Open | Collins John J | $70,000 |
Source: Public Records
Tax History
| Year | Tax Paid | Tax Assessment Tax Assessment Total Assessment is a certain percentage of the fair market value that is determined by local assessors to be the total taxable value of land and additions on the property. | Land | Improvement |
|---|---|---|---|---|
| 2025 | $1,870 | $32,930 | $6,030 | $26,900 |
| 2024 | $1,465 | $32,930 | $6,030 | $26,900 |
| 2023 | $1,101 | $25,820 | $4,670 | $21,150 |
| 2022 | $980 | $25,820 | $4,669 | $21,151 |
| 2021 | $984 | $25,820 | $4,669 | $21,151 |
| 2020 | $990 | $20,910 | $4,120 | $16,790 |
| 2019 | $897 | $23,320 | $4,670 | $18,650 |
| 2018 | $879 | $23,320 | $4,670 | $18,650 |
| 2017 | $1,105 | $23,320 | $4,670 | $18,650 |
| 2016 | $781 | $20,910 | $4,120 | $16,790 |
| 2015 | $787 | $20,910 | $4,120 | $16,790 |
| 2014 | $777 | $20,910 | $4,120 | $16,790 |
| 2013 | $774 | $20,910 | $4,120 | $16,790 |
Source: Public Records
Map
Nearby Homes
- 717 E 2nd St
- 740 E Main St
- 370 S Thomas St
- 715 N Perry St
- 717 & 717 1/2 & 721 E Third St
- 238 N Ohio Ave
- 1535 E 3rd St
- 1823 S Agner St
- 0 Sapphire St Unit 225029940
- 0 Sapphire St Unit 225046385
- 309 Oakview Dr
- 1997 E Main St
- 113 Crabapple Ln
- 331 Chippewa Dr
- 9896 Road M
- 12806 Road K
- 5666 State Route 224
- 13592 Ohio 694
- 10246 Road P9
- 513 N High St
Your Personal Tour Guide
Ask me questions while you tour the home.