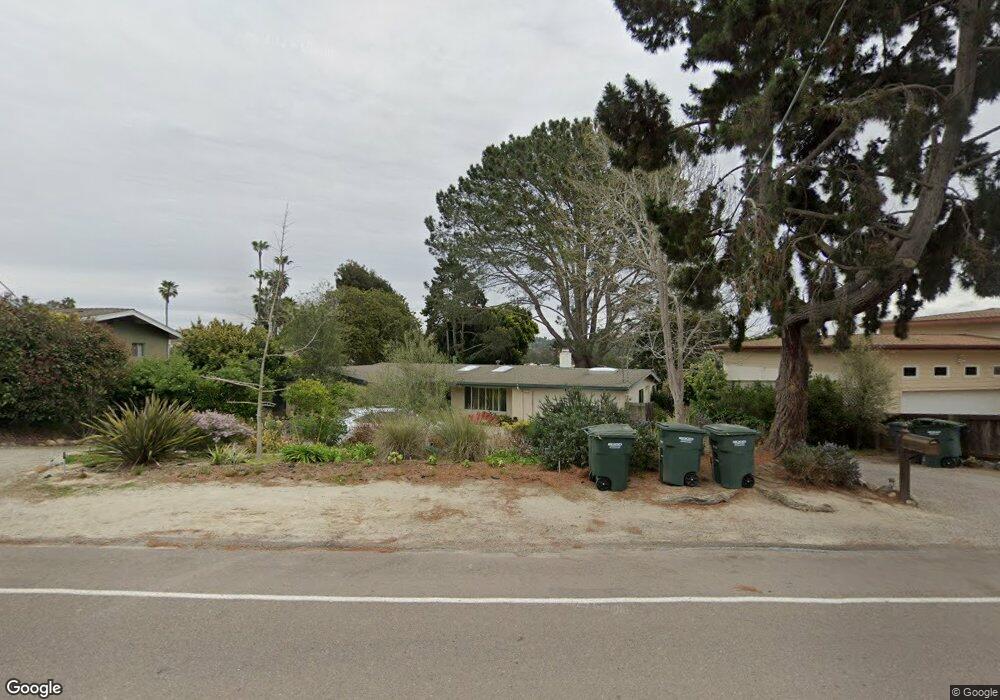
364 Glencrest Dr Solana Beach, CA 92075
Estimated Value: $1,911,000 - $3,206,000
3
Beds
2
Baths
2,277
Sq Ft
$1,163/Sq Ft
Est. Value
About This Home
This home is located at 364 Glencrest Dr, Solana Beach, CA 92075 and is currently estimated at $2,648,855, approximately $1,163 per square foot. 364 Glencrest Dr is a home located in San Diego County with nearby schools including Skyline Elementary School, Solana Vista Elementary School, and Earl Warren Middle School.
Ownership History
Date
Name
Owned For
Owner Type
Purchase Details
Closed on
Jan 25, 2018
Sold by
Laveman Larry and Laveman Joyce
Bought by
Laveman Laurence and Laveman Joyce
Current Estimated Value
Purchase Details
Closed on
Nov 5, 2002
Sold by
Laveman Larry and Laveman Joyce
Bought by
Laveman Laurence L and Laveman Joyce L
Home Financials for this Owner
Home Financials are based on the most recent Mortgage that was taken out on this home.
Original Mortgage
$150,000
Outstanding Balance
$62,505
Interest Rate
5.95%
Estimated Equity
$2,586,350
Purchase Details
Closed on
Sep 11, 2001
Sold by
Solana Beach School District
Bought by
Laveman Larry and Laveman Joyce
Purchase Details
Closed on
Jun 20, 1995
Sold by
The Solana Beach School District
Bought by
Laveman Larry and Laveman Joyce
Create a Home Valuation Report for This Property
The Home Valuation Report is an in-depth analysis detailing your home's value as well as a comparison with similar homes in the area
Home Values in the Area
Average Home Value in this Area
Purchase History
| Date | Buyer | Sale Price | Title Company |
|---|---|---|---|
| Laveman Laurence | -- | None Available | |
| Laveman Laurence L | -- | First American Title Ins Co | |
| Laveman Larry | $9,000 | First American Title | |
| Laveman Larry | -- | -- |
Source: Public Records
Mortgage History
| Date | Status | Borrower | Loan Amount |
|---|---|---|---|
| Open | Laveman Laurence L | $150,000 |
Source: Public Records
Tax History
| Year | Tax Paid | Tax Assessment Tax Assessment Total Assessment is a certain percentage of the fair market value that is determined by local assessors to be the total taxable value of land and additions on the property. | Land | Improvement |
|---|---|---|---|---|
| 2025 | $5,574 | $461,972 | $207,717 | $254,255 |
| 2024 | $5,574 | $452,915 | $203,645 | $249,270 |
| 2023 | $5,466 | $444,035 | $199,652 | $244,383 |
| 2022 | $5,389 | $435,330 | $195,738 | $239,592 |
| 2021 | $5,305 | $426,795 | $191,900 | $234,895 |
| 2020 | $5,265 | $422,420 | $189,933 | $232,487 |
| 2019 | $5,176 | $414,138 | $186,209 | $227,929 |
| 2018 | $5,074 | $406,018 | $182,558 | $223,460 |
| 2017 | $4,982 | $398,058 | $178,979 | $219,079 |
| 2016 | $4,707 | $390,254 | $175,470 | $214,784 |
| 2015 | $4,630 | $384,393 | $172,835 | $211,558 |
| 2014 | $4,533 | $376,864 | $169,450 | $207,414 |
Source: Public Records
Map
Nearby Homes
- 323 Glencrest Dr
- 455 Glencrest Dr
- 607 & 609 N Granados Ave Unit 607 & 609 N Granados
- 612 Barbara Ave
- 831 Santa Rosita
- 971 Santa Helena Park Ct
- 930 Via Mil Cumbres Unit 175
- 433 Seabright Ln
- 418 Santa Dominga
- 779 Barbara Ave
- 725 Santa Florencia
- 637 N Rios Ave
- 601 N Cedros Ave
- 147 S Rios Ave
- 701 Valley Ave
- 211 Ocean St
- 530 San Andres Dr Unit 26
- 131 Ebano Ct
- 135 S Sierra Ave Unit 6
- 501 S Rios Ave
- 372 Glencrest Dr
- 601 Dell St
- 356 Glencrest Dr
- 611 Dell St
- 346 Glencrest Dr
- 615 Dell St
- 402 Glencrest Dr
- 371 Glencrest Dr
- 363 Glencrest Dr
- 347 Glencrest Dr
- 379 Glencrest Dr
- 336 Glencrest Dr
- 610 Dell St
- 355 Glencrest Dr
- 619 Dell St
- 410 Glencrest Dr
- 409 Dell Ct
- 326 Glencrest Dr
- 623 Dell St
- 409 Glencrest Dr
Your Personal Tour Guide
Ask me questions while you tour the home.