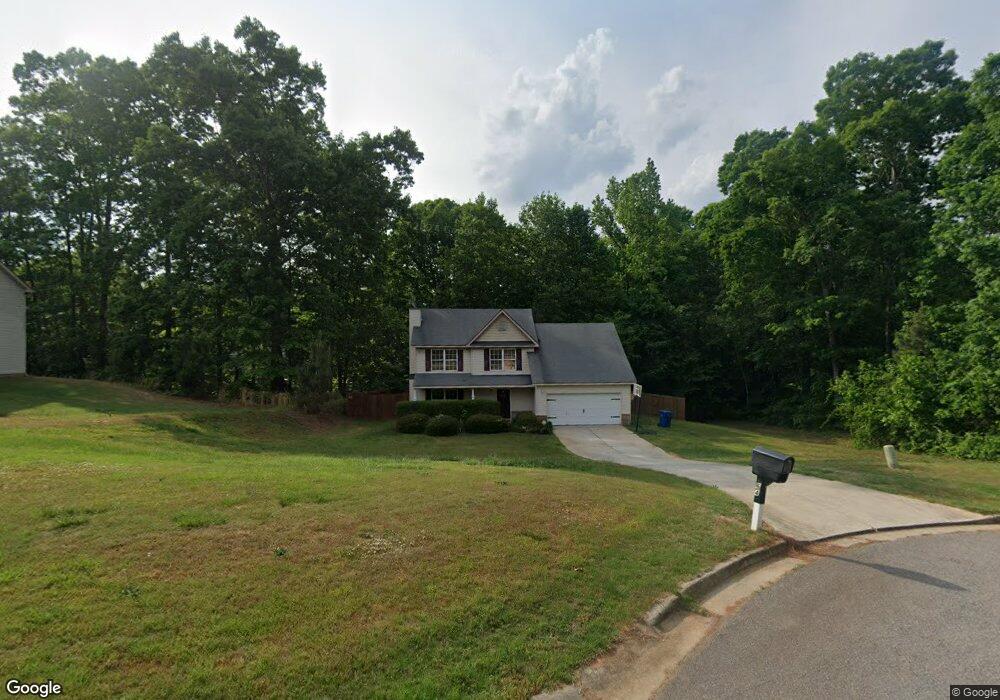
364 Hemlock Ct Winder, GA 30680
Estimated Value: $336,000 - $373,000
3
Beds
3
Baths
1,766
Sq Ft
$200/Sq Ft
Est. Value
About This Home
This home is located at 364 Hemlock Ct, Winder, GA 30680 and is currently estimated at $352,696, approximately $199 per square foot. 364 Hemlock Ct is a home located in Barrow County with nearby schools including Statham Elementary School, Bear Creek Middle School, and Winder-Barrow High School.
Ownership History
Date
Name
Owned For
Owner Type
Purchase Details
Closed on
Mar 20, 2009
Sold by
Damascus Homes Llc
Bought by
Jennings Philip S
Current Estimated Value
Home Financials for this Owner
Home Financials are based on the most recent Mortgage that was taken out on this home.
Original Mortgage
$142,698
Outstanding Balance
$91,504
Interest Rate
5.29%
Mortgage Type
New Conventional
Estimated Equity
$261,192
Purchase Details
Closed on
Jun 11, 2004
Sold by
Eastside Holdings Llc
Bought by
Damascus Homes Llc
Purchase Details
Closed on
Oct 4, 2002
Bought by
Matrix Development Llc
Create a Home Valuation Report for This Property
The Home Valuation Report is an in-depth analysis detailing your home's value as well as a comparison with similar homes in the area
Home Values in the Area
Average Home Value in this Area
Purchase History
| Date | Buyer | Sale Price | Title Company |
|---|---|---|---|
| Jennings Philip S | $139,900 | -- | |
| Damascus Homes Llc | $39,500 | -- | |
| Matrix Development Llc | -- | -- |
Source: Public Records
Mortgage History
| Date | Status | Borrower | Loan Amount |
|---|---|---|---|
| Open | Jennings Philip S | $142,698 |
Source: Public Records
Tax History Compared to Growth
Tax History
| Year | Tax Paid | Tax Assessment Tax Assessment Total Assessment is a certain percentage of the fair market value that is determined by local assessors to be the total taxable value of land and additions on the property. | Land | Improvement |
|---|---|---|---|---|
| 2024 | $2,836 | $114,962 | $27,600 | $87,362 |
| 2023 | $2,433 | $115,562 | $27,600 | $87,962 |
| 2022 | $2,500 | $87,949 | $19,600 | $68,349 |
| 2021 | $2,025 | $67,412 | $16,000 | $51,412 |
| 2020 | $2,025 | $67,412 | $16,000 | $51,412 |
| 2019 | $2,059 | $67,412 | $16,000 | $51,412 |
| 2018 | $1,852 | $61,392 | $12,400 | $48,992 |
| 2017 | $1,410 | $48,438 | $12,400 | $36,038 |
| 2016 | $1,359 | $46,361 | $12,400 | $33,961 |
| 2015 | $1,376 | $46,720 | $12,400 | $34,320 |
| 2014 | $1,261 | $42,518 | $7,840 | $34,678 |
| 2013 | -- | $39,977 | $7,840 | $32,137 |
Source: Public Records
Map
Nearby Homes
- 410 Tori Dr
- 1610 Trey Ln
- 364 Pleasant Hill Church Rd
- 532 Hemlock Dr
- 364 Pleasant Hill Church Rd SE
- 2070 Dooley Town Rd
- 1849 Dooley Town Rd
- 2141 Kirkland Dr
- 1679 Atlanta Hwy SE
- The Baxley Plan at Statham Place
- The Landon II Plan at Statham Place
- 162 Ashton Ln
- 79 Lyles Corner
- 384 Sunset Dr
- 197 Pleasant Hill Church Rd SE
- 390 Sunset Dr
- 226 Baker St
- 43 Lyles Corner
- 26 Lyles Corner
- 576 Lillian Way