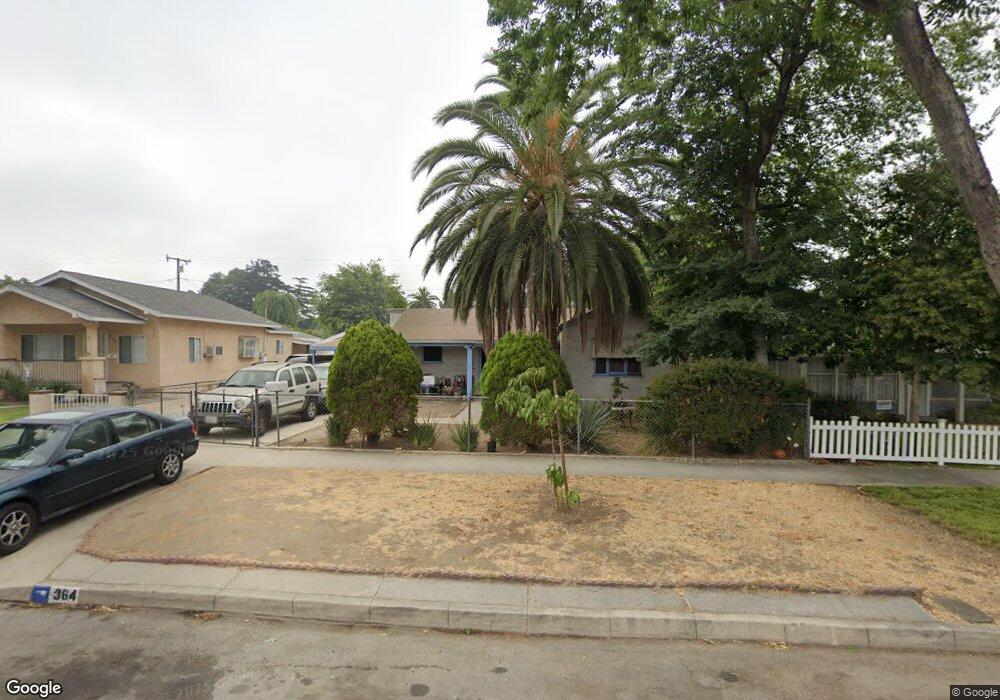
364 S 2nd Ave Upland, CA 91786
Estimated Value: $537,000 - $611,000
2
Beds
1
Bath
792
Sq Ft
$719/Sq Ft
Est. Value
About This Home
This home is located at 364 S 2nd Ave, Upland, CA 91786 and is currently estimated at $569,474, approximately $719 per square foot. 364 S 2nd Ave is a home located in San Bernardino County with nearby schools including Edison Elementary School, Vina Danks Middle, and Chaffey High School.
Ownership History
Date
Name
Owned For
Owner Type
Purchase Details
Closed on
Jul 20, 2017
Sold by
The Joyce A C Johnson Trust Of 2008
Bought by
Montelongo Robles Mario
Current Estimated Value
Home Financials for this Owner
Home Financials are based on the most recent Mortgage that was taken out on this home.
Original Mortgage
$150,000
Outstanding Balance
$124,864
Interest Rate
3.96%
Mortgage Type
Purchase Money Mortgage
Estimated Equity
$444,610
Purchase Details
Closed on
Sep 2, 2008
Sold by
Johnson Joyce A C
Bought by
Johnson Joyce A C and Joyce A C Johnson Trust Of 200
Create a Home Valuation Report for This Property
The Home Valuation Report is an in-depth analysis detailing your home's value as well as a comparison with similar homes in the area
Home Values in the Area
Average Home Value in this Area
Purchase History
| Date | Buyer | Sale Price | Title Company |
|---|---|---|---|
| Montelongo Robles Mario | $275,000 | Chicago Title Company | |
| Johnson Joyce A C | -- | None Available |
Source: Public Records
Mortgage History
| Date | Status | Borrower | Loan Amount |
|---|---|---|---|
| Open | Montelongo Robles Mario | $150,000 |
Source: Public Records
Tax History
| Year | Tax Paid | Tax Assessment Tax Assessment Total Assessment is a certain percentage of the fair market value that is determined by local assessors to be the total taxable value of land and additions on the property. | Land | Improvement |
|---|---|---|---|---|
| 2025 | $3,555 | $312,904 | $109,516 | $203,388 |
| 2024 | $3,471 | $306,769 | $107,369 | $199,400 |
| 2023 | $3,372 | $300,754 | $105,264 | $195,490 |
| 2022 | $3,323 | $294,857 | $103,200 | $191,657 |
| 2021 | $3,297 | $289,075 | $101,176 | $187,899 |
| 2020 | $3,237 | $286,111 | $100,139 | $185,972 |
| 2019 | $3,209 | $280,500 | $98,175 | $182,325 |
| 2018 | $3,166 | $275,000 | $96,250 | $178,750 |
| 2017 | $2,059 | $171,998 | $55,483 | $116,515 |
| 2016 | $1,823 | $168,625 | $54,395 | $114,230 |
| 2015 | $1,811 | $166,092 | $53,578 | $112,514 |
| 2014 | $1,755 | $162,838 | $52,528 | $110,310 |
Source: Public Records
Map
Nearby Homes
Your Personal Tour Guide
Ask me questions while you tour the home.