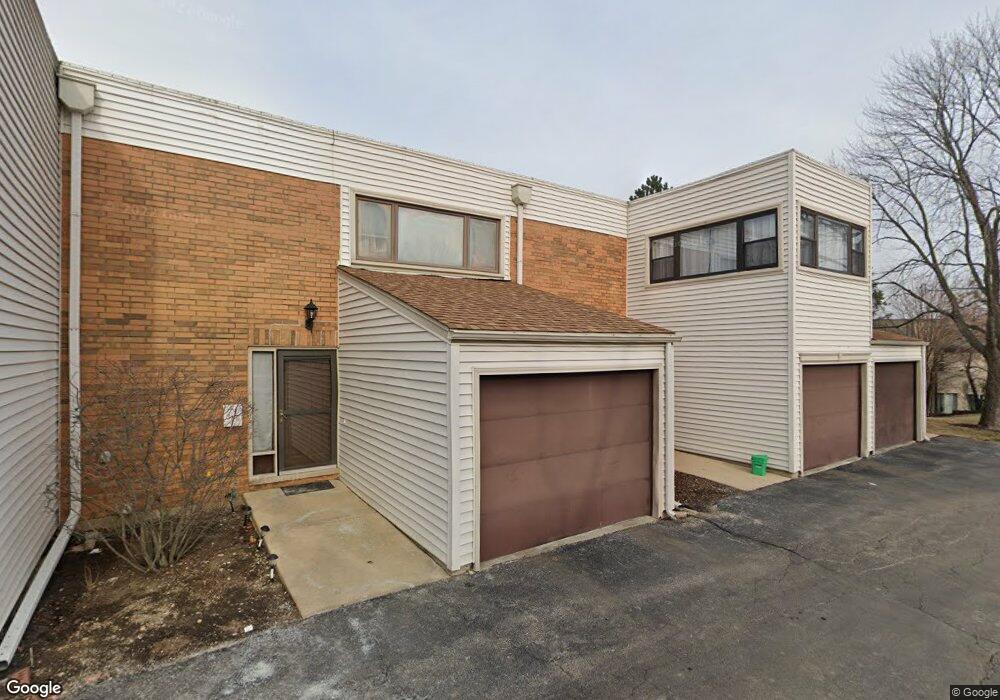
364 Willow Tree Ct Unit 2 Hoffman Estates, IL 60169
South Hoffman Estates NeighborhoodEstimated Value: $319,911 - $355,000
3
Beds
3
Baths
1,439
Sq Ft
$239/Sq Ft
Est. Value
About This Home
This home is located at 364 Willow Tree Ct Unit 2, Hoffman Estates, IL 60169 and is currently estimated at $343,228, approximately $238 per square foot. 364 Willow Tree Ct Unit 2 is a home located in Cook County with nearby schools including Lakeview Elementary School, Helen Keller Junior High School, and J B Conant High School.
Ownership History
Date
Name
Owned For
Owner Type
Purchase Details
Closed on
May 15, 2016
Sold by
Patel Kalpesh S and Bhargava Shilpi
Bought by
Blanchard Michael A
Current Estimated Value
Home Financials for this Owner
Home Financials are based on the most recent Mortgage that was taken out on this home.
Original Mortgage
$194,085
Outstanding Balance
$152,421
Interest Rate
3.5%
Mortgage Type
VA
Estimated Equity
$190,807
Purchase Details
Closed on
Aug 20, 2001
Sold by
Alessi Frank and Alessi Margaret J
Bought by
Patel Somabhai S and Patel Babibahen S
Home Financials for this Owner
Home Financials are based on the most recent Mortgage that was taken out on this home.
Original Mortgage
$115,000
Interest Rate
7.11%
Mortgage Type
Stand Alone First
Purchase Details
Closed on
Sep 25, 1995
Sold by
Barra David R
Bought by
Alessi Frank and Alessi Margaret J
Home Financials for this Owner
Home Financials are based on the most recent Mortgage that was taken out on this home.
Original Mortgage
$114,750
Interest Rate
7.45%
Create a Home Valuation Report for This Property
The Home Valuation Report is an in-depth analysis detailing your home's value as well as a comparison with similar homes in the area
Home Values in the Area
Average Home Value in this Area
Purchase History
| Date | Buyer | Sale Price | Title Company |
|---|---|---|---|
| Blanchard Michael A | $190,000 | Greater Indiana Title | |
| Patel Somabhai S | $155,000 | -- | |
| Alessi Frank | $113,000 | -- |
Source: Public Records
Mortgage History
| Date | Status | Borrower | Loan Amount |
|---|---|---|---|
| Open | Blanchard Michael A | $194,085 | |
| Previous Owner | Patel Somabhai S | $115,000 | |
| Previous Owner | Alessi Frank | $114,750 |
Source: Public Records
Tax History
| Year | Tax Paid | Tax Assessment Tax Assessment Total Assessment is a certain percentage of the fair market value that is determined by local assessors to be the total taxable value of land and additions on the property. | Land | Improvement |
|---|---|---|---|---|
| 2025 | $6,403 | $28,000 | $1,543 | $26,457 |
| 2024 | $6,403 | $20,866 | $3,501 | $17,365 |
| 2023 | $6,196 | $20,866 | $3,501 | $17,365 |
| 2022 | $6,196 | $20,866 | $3,501 | $17,365 |
| 2021 | $5,837 | $17,422 | $1,543 | $15,879 |
| 2020 | $5,701 | $17,422 | $1,543 | $15,879 |
| 2019 | $5,731 | $19,576 | $1,543 | $18,033 |
| 2018 | $7,298 | $22,380 | $1,286 | $21,094 |
| 2017 | $7,168 | $22,380 | $1,286 | $21,094 |
| 2016 | $5,924 | $22,380 | $1,286 | $21,094 |
| 2015 | $5,117 | $18,556 | $1,125 | $17,431 |
| 2014 | $5,044 | $18,556 | $1,125 | $17,431 |
| 2013 | $5,705 | $18,556 | $1,125 | $17,431 |
Source: Public Records
Map
Nearby Homes
- 368 Willow Tree Ct
- 988 Butter Creek Ct Unit 4ND
- 367 Juniper Tree Ct Unit 3
- 860 Olive St
- 555 Heritage Dr Unit 315
- 600 Mesa Dr Unit 103
- 829 Linden Cir
- 1180 Meadow Ln Unit 6306
- 630 Bode Rd
- 720 Hill Dr Unit 8303
- 730 Hill Dr Unit 9205
- 1045 Higgins Quarters Dr Unit 4-101
- 1025 Higgins Quarters Dr Unit 4-109
- 625 Morton St
- 660 Flagstaff Ln
- 1335 Gentry Rd
- 670 Lakeview Ln
- 75 Carthage Ln
- 345 Maricopa Ln
- 480 Illinois Blvd
- 364 Willow Tree Ct Unit 364
- 362 Willow Tree Ct
- 366 Willow Tree Ct
- 370 Willow Tree Ct
- 370 Willow Tree Ct Unit N
- 968 Butter Creek Ct Unit 5NA
- 968 Butter Creek Ct Unit 968
- 361 Willow Tree Ct Unit 2
- 970 Butter Creek Ct Unit 5NB
- 966 Butter Creek Ct Unit 6NA
- 972 Butter Creek Ct Unit 5NC
- 372 Willow Tree Ct
- 964 Butter Creek Ct Unit 6NB
- 967 Spring Mill Dr
- 363 Willow Tree Ct
- 962 Butter Creek Ct Unit 6NE
- 974 Butter Creek Ct Unit 5ND
- 974 Butter Creek Ct Unit N-D-4
- 374 Willow Tree Ct
- 369 Oaktree Ct
Your Personal Tour Guide
Ask me questions while you tour the home.