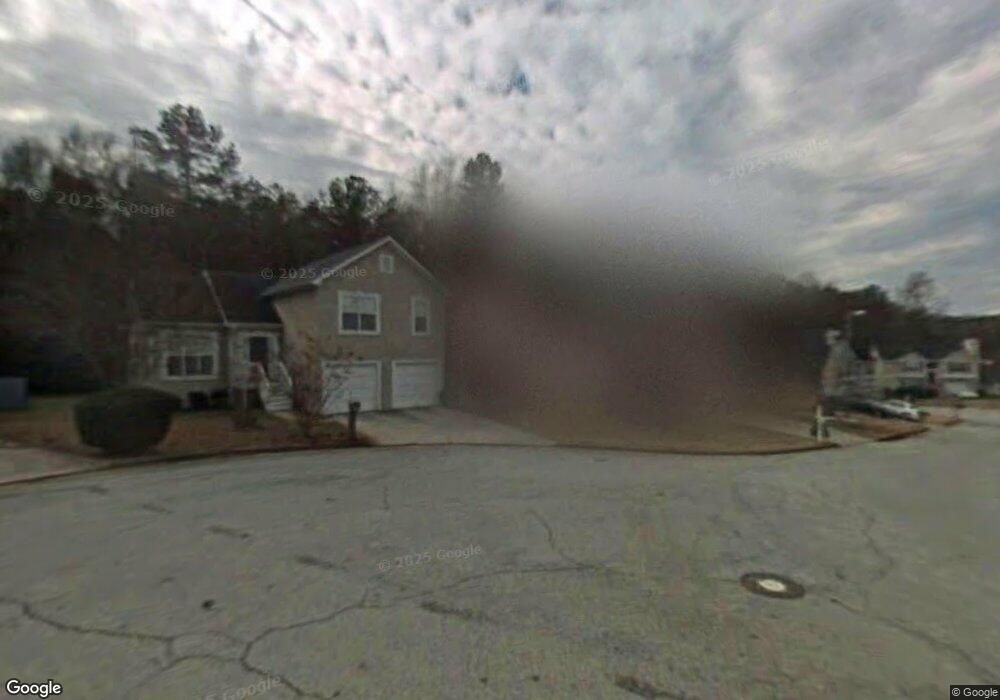
3641 Boulder Ridge Ct Ellenwood, GA 30294
Southwest DeKalb NeighborhoodEstimated Value: $219,000 - $246,000
3
Beds
2
Baths
1,881
Sq Ft
$123/Sq Ft
Est. Value
About This Home
This home is located at 3641 Boulder Ridge Ct, Ellenwood, GA 30294 and is currently estimated at $231,564, approximately $123 per square foot. 3641 Boulder Ridge Ct is a home with nearby schools including Cedar Grove Elementary School, Cedar Grove Middle School, and Cedar Grove High School.
Ownership History
Date
Name
Owned For
Owner Type
Purchase Details
Closed on
Dec 3, 2015
Sold by
Secretary Of Housing And Urban Dev Of Wa
Bought by
Cromwell Sandra and Cromwell Trevor
Current Estimated Value
Purchase Details
Closed on
Aug 6, 2013
Sold by
Jpmorgan Chase Bank Na
Bought by
Secretary Of Housing & Urban Dev Of Wash and C/O Michaelson Connor & Boul Inc
Purchase Details
Closed on
Apr 1, 2013
Sold by
Jmm Assets & Acquisitions
Bought by
Powell Devontae Deshun and Jmm Assets & Acquisitions Mana
Purchase Details
Closed on
Oct 9, 2006
Sold by
Brooks Sandra J
Bought by
Hunter Veronica D
Purchase Details
Closed on
Feb 25, 2002
Sold by
Mosley Donald L
Bought by
Hunter Veronica D
Home Financials for this Owner
Home Financials are based on the most recent Mortgage that was taken out on this home.
Original Mortgage
$122,182
Interest Rate
6.89%
Mortgage Type
FHA
Create a Home Valuation Report for This Property
The Home Valuation Report is an in-depth analysis detailing your home's value as well as a comparison with similar homes in the area
Home Values in the Area
Average Home Value in this Area
Purchase History
| Date | Buyer | Sale Price | Title Company |
|---|---|---|---|
| Cromwell Sandra | $60,502 | -- | |
| Secretary Of Housing & Urban Dev Of Wash | $147,309 | -- | |
| Jpmorgan Chase Bank Na | $170,905 | -- | |
| Powell Devontae Deshun | -- | -- | |
| Hunter Veronica D | -- | -- | |
| Hunter Veronica D | $124,100 | -- |
Source: Public Records
Mortgage History
| Date | Status | Borrower | Loan Amount |
|---|---|---|---|
| Previous Owner | Hunter Veronica D | $122,182 |
Source: Public Records
Tax History Compared to Growth
Tax History
| Year | Tax Paid | Tax Assessment Tax Assessment Total Assessment is a certain percentage of the fair market value that is determined by local assessors to be the total taxable value of land and additions on the property. | Land | Improvement |
|---|---|---|---|---|
| 2025 | $2,710 | $104,280 | $14,000 | $90,280 |
| 2024 | $2,097 | $76,120 | $13,702 | $62,418 |
| 2023 | $2,097 | $76,120 | $13,702 | $62,418 |
| 2022 | $1,706 | $76,120 | $14,000 | $62,120 |
| 2021 | $1,706 | $62,920 | $8,000 | $54,920 |
| 2020 | $1,561 | $56,440 | $8,000 | $48,440 |
| 2019 | $1,131 | $38,160 | $3,816 | $34,344 |
| 2018 | $1,385 | $38,160 | $3,816 | $34,344 |
| 2017 | $1,159 | $38,160 | $3,816 | $34,344 |
| 2016 | $748 | $24,168 | $3,248 | $20,920 |
| 2014 | $1,760 | $31,960 | $4,000 | $27,960 |
Source: Public Records
Map
Nearby Homes
- 4.2 + -Acres River Rd
- 3444 Sugar Creek Cove Unit 16
- 2987 Bouldercrest Rd
- 2103 River Rd
- 3871 Martin Dr
- 3664 Satellite Terrace
- 1974 Boulder Gate Dr
- 1993 Whitehall Forest Ct SE
- 1997 Whitehall Forest Ct SE
- 2131 Brentwood Cove
- 1847 Whitehall Forest Ct SE
- 3541 Santa Leta Dr
- 3287 River Ln SE
- 3932 Misty Lake
- 3812 Misty Lake
- 2324 Carrington Dr
- 2385 River Rd
- 3283 Sugar Creek Falls Ave SE
- 3641 Boulder Ridge Ct
- 3639 Boulder Ridge Ct
- 3645 Boulder Ridge Ct
- 3645 Boulder Ridge Ct
- 0 Boulder Ridge Ct Unit 7501423
- 0 Boulder Ridge Ct Unit 3128070
- 0 Boulder Ridge Ct Unit 7540528
- 0 Boulder Ridge Ct Unit 8683712
- 0 Boulder Ridge Ct Unit 8852664
- 0 Boulder Ridge Ct
- 3635 Boulder Ridge Ct
- 3649 Boulder Ridge Ct
- 3636 Boulder Ridge Ct
- 3635 Boulder Ridge Ct
- 3646 Boulder Ridge Ct
- 3719 Boulder Cir
- 3633 Boulder Ridge Ct
- 3631 Boulder Ridge Ct
- 3653 Boulder Ridge Ct
- 3650 Boulder Ridge Ct