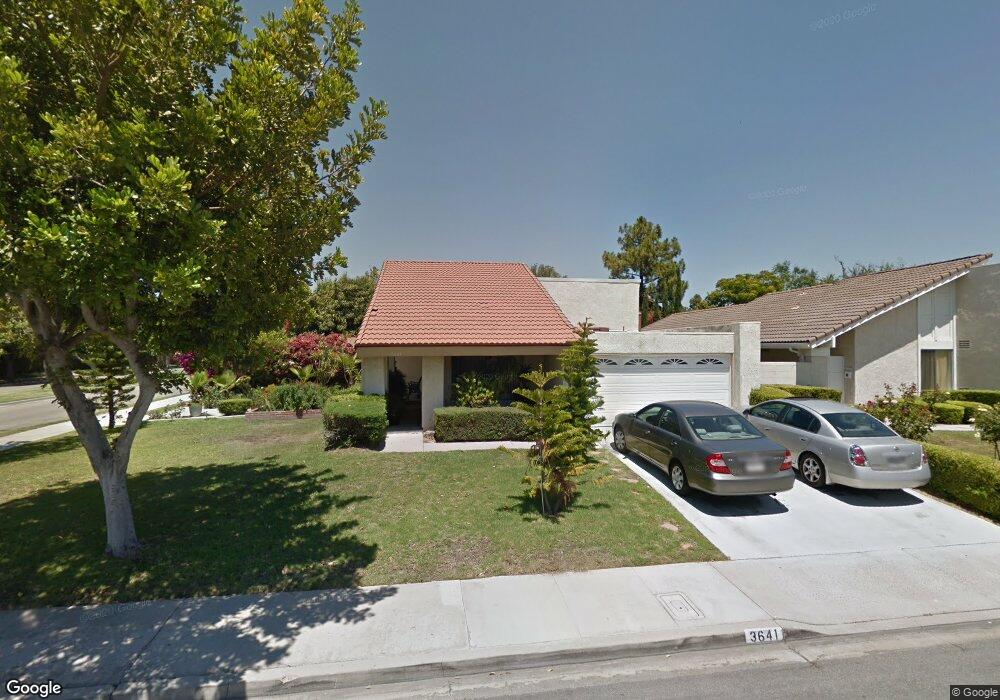
3641 Carmel Ave Irvine, CA 92606
Walnut NeighborhoodEstimated Value: $1,448,000 - $1,524,000
3
Beds
2
Baths
1,583
Sq Ft
$945/Sq Ft
Est. Value
About This Home
This home is located at 3641 Carmel Ave, Irvine, CA 92606 and is currently estimated at $1,495,562, approximately $944 per square foot. 3641 Carmel Ave is a home located in Orange County with nearby schools including College Park Elementary School, Venado Middle School, and Irvine High School.
Ownership History
Date
Name
Owned For
Owner Type
Purchase Details
Closed on
Dec 12, 2019
Sold by
Tahvildaran Bobby A
Bought by
Tahvildaran Bobby A and Tahvildaran Separate T Bobby A
Current Estimated Value
Purchase Details
Closed on
Feb 8, 2010
Sold by
Tahvildaran Boback A
Bought by
Tahvildaran Bobby A
Home Financials for this Owner
Home Financials are based on the most recent Mortgage that was taken out on this home.
Original Mortgage
$449,000
Outstanding Balance
$298,349
Interest Rate
5.11%
Mortgage Type
New Conventional
Estimated Equity
$1,197,213
Purchase Details
Closed on
Apr 6, 2000
Sold by
Min Chung Ho and Shu Chen L L
Bought by
Tahvildaran Boback A
Home Financials for this Owner
Home Financials are based on the most recent Mortgage that was taken out on this home.
Original Mortgage
$240,300
Interest Rate
4.95%
Create a Home Valuation Report for This Property
The Home Valuation Report is an in-depth analysis detailing your home's value as well as a comparison with similar homes in the area
Home Values in the Area
Average Home Value in this Area
Purchase History
| Date | Buyer | Sale Price | Title Company |
|---|---|---|---|
| Tahvildaran Bobby A | -- | None Available | |
| Tahvildaran Bobby A | -- | None Available | |
| Tahvildaran Bobby A | -- | Stewart Title Irvine | |
| Tahvildaran Boback A | $267,000 | South Coast Title Company |
Source: Public Records
Mortgage History
| Date | Status | Borrower | Loan Amount |
|---|---|---|---|
| Open | Tahvildaran Bobby A | $449,000 | |
| Closed | Tahvildaran Boback A | $240,300 |
Source: Public Records
Tax History
| Year | Tax Paid | Tax Assessment Tax Assessment Total Assessment is a certain percentage of the fair market value that is determined by local assessors to be the total taxable value of land and additions on the property. | Land | Improvement |
|---|---|---|---|---|
| 2025 | $4,385 | $410,361 | $284,840 | $125,521 |
| 2024 | $4,385 | $402,315 | $279,255 | $123,060 |
| 2023 | $4,272 | $394,427 | $273,779 | $120,648 |
| 2022 | $4,187 | $386,694 | $268,411 | $118,283 |
| 2021 | $4,090 | $379,112 | $263,148 | $115,964 |
| 2020 | $4,067 | $375,225 | $260,450 | $114,775 |
| 2019 | $3,977 | $367,868 | $255,343 | $112,525 |
| 2018 | $3,905 | $360,655 | $250,336 | $110,319 |
| 2017 | $3,825 | $353,584 | $245,428 | $108,156 |
| 2016 | $3,659 | $346,651 | $240,615 | $106,036 |
| 2015 | $3,551 | $341,444 | $237,000 | $104,444 |
| 2014 | $3,483 | $334,756 | $232,357 | $102,399 |
Source: Public Records
Map
Nearby Homes
- 3761 Provincetown Ave
- 3852 Uris Ct
- 14541 Savin Ave
- 14272 Saarinen Ct
- 14072 Picasso Ct
- 17 Rhode Island
- 14172 Moore Ct
- 1 Emperor
- 4161 Old Mill St
- 4062 Escudero Dr
- 14 Wakefield
- 175 Zephyr Run Unit 175
- 24 Millstone Unit 137
- 424 Deerfield Ave Unit 172
- 280 Tustin Field Dr
- 328 Flyers Ln
- 390 Deerfield Ave Unit 125
- 40 Bolinas Unit 5
- 369 Deerfield Ave Unit 35
- 374 Aviator Ln
- 3651 Carmel Ave
- 3666 S Mall St
- 3661 Carmel Ave
- 3662 S Mall St
- 3611 Carmel Ave
- 3642 Carmel Ave
- 3672 S Mall St
- 3652 Carmel Ave
- 3656 S Mall St
- 3671 Carmel Ave
- 3681 Carmel Ave
- 3662 Carmel Ave
- 3676 S Mall St
- 3601 Carmel Ave
- 3652 S Mall St
- 3672 Carmel Ave
- 3612 Carmel Ave
- 3592 S Mall St
- 3596 S Mall St
- 3691 Carmel Ave
Your Personal Tour Guide
Ask me questions while you tour the home.