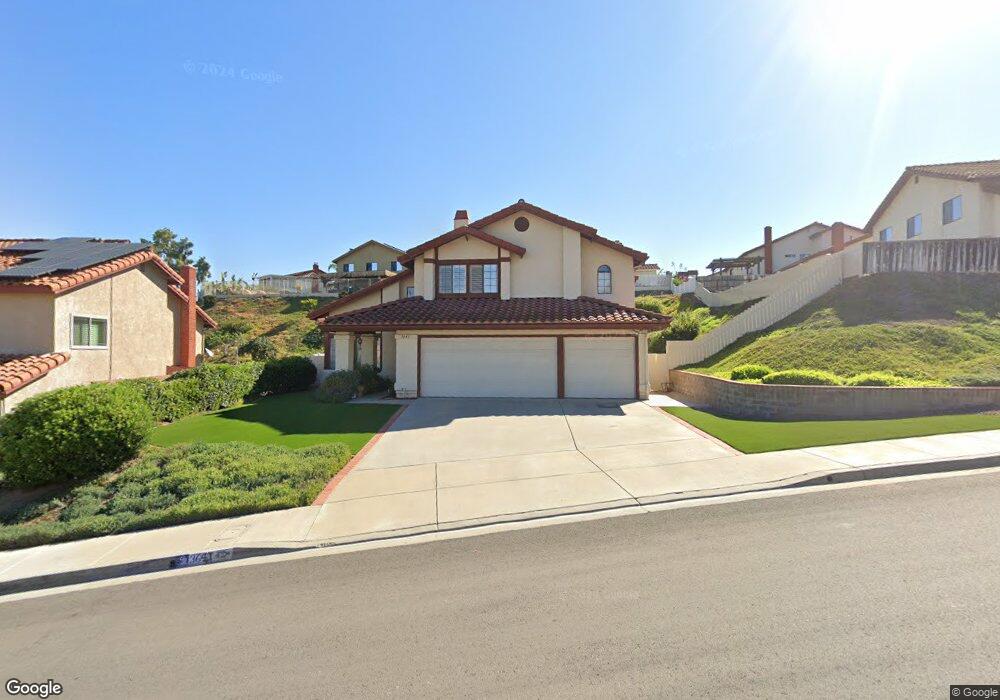
3641 Summerfield Dr Spring Valley, CA 91977
Estimated Value: $902,000 - $973,000
4
Beds
2
Baths
2,306
Sq Ft
$406/Sq Ft
Est. Value
About This Home
This home is located at 3641 Summerfield Dr, Spring Valley, CA 91977 and is currently estimated at $935,360, approximately $405 per square foot. 3641 Summerfield Dr is a home located in San Diego County with nearby schools including Spring Valley Middle School, Murdock Elementary School, and Monte Vista High School.
Ownership History
Date
Name
Owned For
Owner Type
Purchase Details
Closed on
Jun 14, 2012
Sold by
Haase Jay and Haase Kathy L
Bought by
Haase Jay and Haase Kathy L
Current Estimated Value
Home Financials for this Owner
Home Financials are based on the most recent Mortgage that was taken out on this home.
Original Mortgage
$85,000
Outstanding Balance
$12,560
Interest Rate
3.77%
Mortgage Type
New Conventional
Estimated Equity
$922,800
Purchase Details
Closed on
Nov 15, 2006
Sold by
Haase Jay S and Haase Kathy L
Bought by
Haase Jay and Haase Kathy L
Home Financials for this Owner
Home Financials are based on the most recent Mortgage that was taken out on this home.
Original Mortgage
$100,000
Interest Rate
6.28%
Mortgage Type
Stand Alone Refi Refinance Of Original Loan
Purchase Details
Closed on
Mar 27, 2006
Sold by
Haase Jay Steven and Haase Kathy Lynn
Bought by
Haase Jay and Haase Kathy L
Purchase Details
Closed on
Nov 10, 1987
Create a Home Valuation Report for This Property
The Home Valuation Report is an in-depth analysis detailing your home's value as well as a comparison with similar homes in the area
Home Values in the Area
Average Home Value in this Area
Purchase History
| Date | Buyer | Sale Price | Title Company |
|---|---|---|---|
| Haase Jay | -- | Accommodation | |
| Haase Jay | -- | Lsi Title Company | |
| Haase Jay | -- | Accommodation | |
| Haase Jay S | -- | Fidelity National Title Co | |
| Haase Jay | -- | None Available | |
| -- | $178,000 | -- |
Source: Public Records
Mortgage History
| Date | Status | Borrower | Loan Amount |
|---|---|---|---|
| Open | Haase Jay | $85,000 | |
| Closed | Haase Jay S | $100,000 |
Source: Public Records
Tax History
| Year | Tax Paid | Tax Assessment Tax Assessment Total Assessment is a certain percentage of the fair market value that is determined by local assessors to be the total taxable value of land and additions on the property. | Land | Improvement |
|---|---|---|---|---|
| 2025 | $4,482 | $340,657 | $95,689 | $244,968 |
| 2024 | $4,482 | $333,978 | $93,813 | $240,165 |
| 2023 | $4,338 | $327,430 | $91,974 | $235,456 |
| 2022 | $4,263 | $321,011 | $90,171 | $230,840 |
| 2021 | $4,222 | $314,717 | $88,403 | $226,314 |
| 2020 | $4,051 | $311,491 | $87,497 | $223,994 |
| 2019 | $3,990 | $305,384 | $85,782 | $219,602 |
| 2018 | $3,866 | $299,397 | $84,100 | $215,297 |
| 2017 | $832 | $293,527 | $82,451 | $211,076 |
| 2016 | $3,629 | $287,773 | $80,835 | $206,938 |
| 2015 | $3,599 | $283,451 | $79,621 | $203,830 |
| 2014 | $3,533 | $277,900 | $78,062 | $199,838 |
Source: Public Records
Map
Nearby Homes
- 9517 Bray Ave
- 9356 1 2 Lamar St
- 3404 Helix St
- 3557 Kenora Dr Unit 22
- 00 Helix St Unit 237
- 9309 Hillside Dr
- 3821-23 Rogers Ln
- 3043-45 Helix St
- 3237 S Bonita St
- 9034 Kenwood Dr Unit 10
- 9860 Dale Ave Unit D8
- 9860 Dale Ave Unit B9
- 9860 Dale Ave Unit C3
- 3365 S Bonita St
- 3221 Bancroft Dr Unit 24
- 9938 Buena Vista Dr Unit 3
- 2840 Helix St
- 3612 S Cordoba Ave Unit 14
- 3404 S Cordoba Ave
- 4001 N Bonita St
- 3649 Summerfield Dr
- 3585 Boyne St
- 3571 Boyne St
- 3502 Quail View St
- 3510 Quail View St Unit 399
- 3657 Summerfield Dr
- 3557 Boyne St
- 3518 Quail View St
- 3642 Summerfield Dr
- 3634 Summerfield Dr
- 3650 Summerfield Dr
- 3578 Boyne St
- 3527 Quail View St
- 9521 Summerfield St
- 3626 Summerfield Dr
- 9511 Summerfield St
- 9501 Summerfield St
- 3658 Summerfield Dr
- 3543 Boyne St
- 3564 Boyne St
Your Personal Tour Guide
Ask me questions while you tour the home.