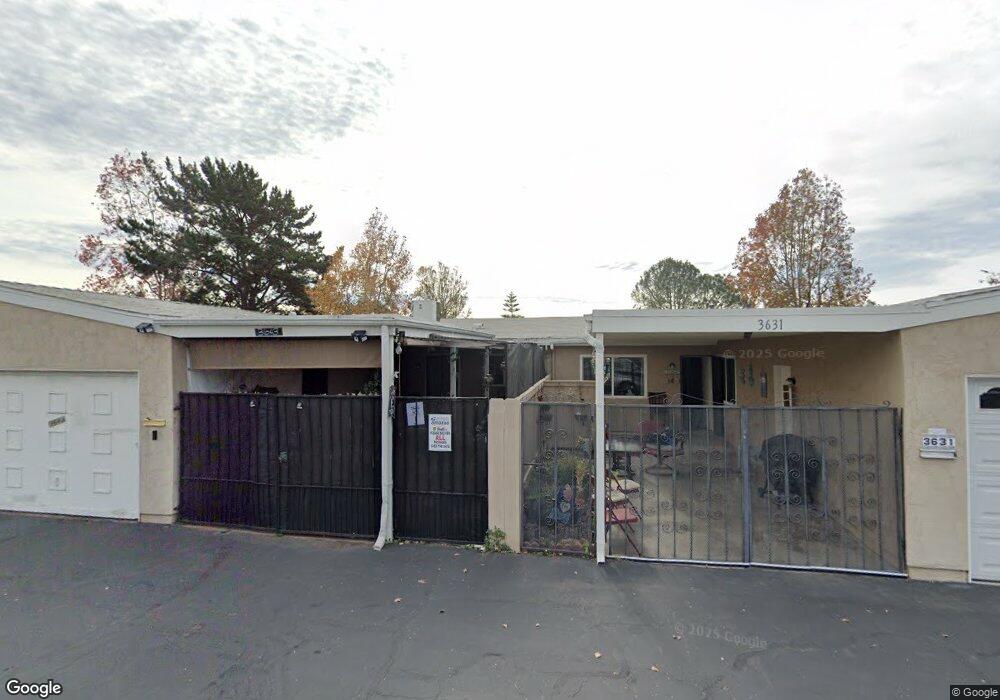
3643 Brandywine St Oceanside, CA 92057
Oceana NeighborhoodEstimated Value: $373,000 - $434,000
2
Beds
2
Baths
1,050
Sq Ft
$379/Sq Ft
Est. Value
About This Home
This home is located at 3643 Brandywine St, Oceanside, CA 92057 and is currently estimated at $397,742, approximately $378 per square foot. 3643 Brandywine St is a home located in San Diego County with nearby schools including San Luis Rey Elementary School, Martin Luther King Jr. Middle School, and El Camino High School.
Ownership History
Date
Name
Owned For
Owner Type
Purchase Details
Closed on
Dec 1, 1999
Sold by
Dian Faye
Bought by
Faye Dian
Current Estimated Value
Purchase Details
Closed on
May 6, 1998
Sold by
Heinzmann Helgi
Bought by
Faye Dian
Home Financials for this Owner
Home Financials are based on the most recent Mortgage that was taken out on this home.
Original Mortgage
$52,000
Outstanding Balance
$11,728
Interest Rate
8.85%
Estimated Equity
$386,014
Purchase Details
Closed on
May 5, 1998
Sold by
Sol Sanders and Anne Thalassinos
Bought by
Faye Dian
Home Financials for this Owner
Home Financials are based on the most recent Mortgage that was taken out on this home.
Original Mortgage
$52,000
Outstanding Balance
$11,728
Interest Rate
8.85%
Estimated Equity
$386,014
Purchase Details
Closed on
Jan 4, 1994
Sold by
Sanders Sol
Bought by
Sanders Sol and Thalassinos Anne
Purchase Details
Closed on
Jul 19, 1993
Purchase Details
Closed on
Sep 30, 1986
Create a Home Valuation Report for This Property
The Home Valuation Report is an in-depth analysis detailing your home's value as well as a comparison with similar homes in the area
Home Values in the Area
Average Home Value in this Area
Purchase History
| Date | Buyer | Sale Price | Title Company |
|---|---|---|---|
| Faye Dian | -- | -- | |
| Faye Dian | -- | South Coast Title Company | |
| Faye Dian | $65,000 | South Coast Title Company | |
| Sanders Sol | -- | First American Title Co | |
| -- | $70,000 | -- | |
| -- | $63,700 | -- |
Source: Public Records
Mortgage History
| Date | Status | Borrower | Loan Amount |
|---|---|---|---|
| Open | Faye Dian | $52,000 |
Source: Public Records
Tax History
| Year | Tax Paid | Tax Assessment Tax Assessment Total Assessment is a certain percentage of the fair market value that is determined by local assessors to be the total taxable value of land and additions on the property. | Land | Improvement |
|---|---|---|---|---|
| 2025 | $1,188 | $103,755 | $36,082 | $67,673 |
| 2024 | $1,188 | $101,722 | $35,375 | $66,347 |
| 2023 | $1,152 | $99,729 | $34,682 | $65,047 |
| 2022 | $1,134 | $97,774 | $34,002 | $63,772 |
| 2021 | $1,139 | $95,858 | $33,336 | $62,522 |
| 2020 | $1,105 | $94,876 | $32,995 | $61,881 |
| 2019 | $1,074 | $93,017 | $32,349 | $60,668 |
| 2018 | $1,063 | $91,194 | $31,715 | $59,479 |
| 2017 | $71 | $89,407 | $31,094 | $58,313 |
| 2016 | $1,009 | $87,655 | $30,485 | $57,170 |
| 2015 | $981 | $86,340 | $30,028 | $56,312 |
| 2014 | $945 | $84,649 | $29,440 | $55,209 |
Source: Public Records
Map
Nearby Homes
- 3625 Dearborn St
- 3592 Boussock Ln
- 3621 Vista Campana S
- 3621 Vista Campana S Unit 92
- 3621 Vista Campana S Unit 53
- 3621 Vista Campana S Unit 64
- 3621 Vista Campana S Unit 11
- 3747 Vista Campana S Unit 97
- 3760 Vista Campana S Unit 76
- 3760 Vista Campana S Unit 15
- 3760 Vista Campana S Unit 72
- 3760 Vista Campana S Unit 81
- 3625 Vista Oceana Unit 37
- 3685 Vista Campana N Unit 39
- 3685 Vista Campana N
- 3808 Vista Campana S Unit 29
- 3808 Vista Campana S Unit 22
- 3808 Vista Campana S
- 3755 Vista Campana N Unit 17
- 3755 Vista Campana N Unit 34
- 3649 Brandywine St Unit 3
- 3631 Brandywine St
- 3625 Brandywine St
- 3655 Brandywine St
- 3661 Brandywine St
- 3619 Brandywine St
- 3644 Mount Vernon Ave
- 3632 Mount Vernon Ave
- 3626 Mount Vernon Ave
- 3650 Mount Vernon Ave
- 3613 Brandywine St
- 3667 Brandywine St
- 3620 Mount Vernon Ave
- 3607 Brandywine St
- 3614 Mount Vernon Ave
- 3662 Mount Vernon Ave Unit 3
- 3662 Mount Vernon Ave
- 3673 Brandywine St
- 3601 Brandywine St
- 3686 Kieffer St
Your Personal Tour Guide
Ask me questions while you tour the home.