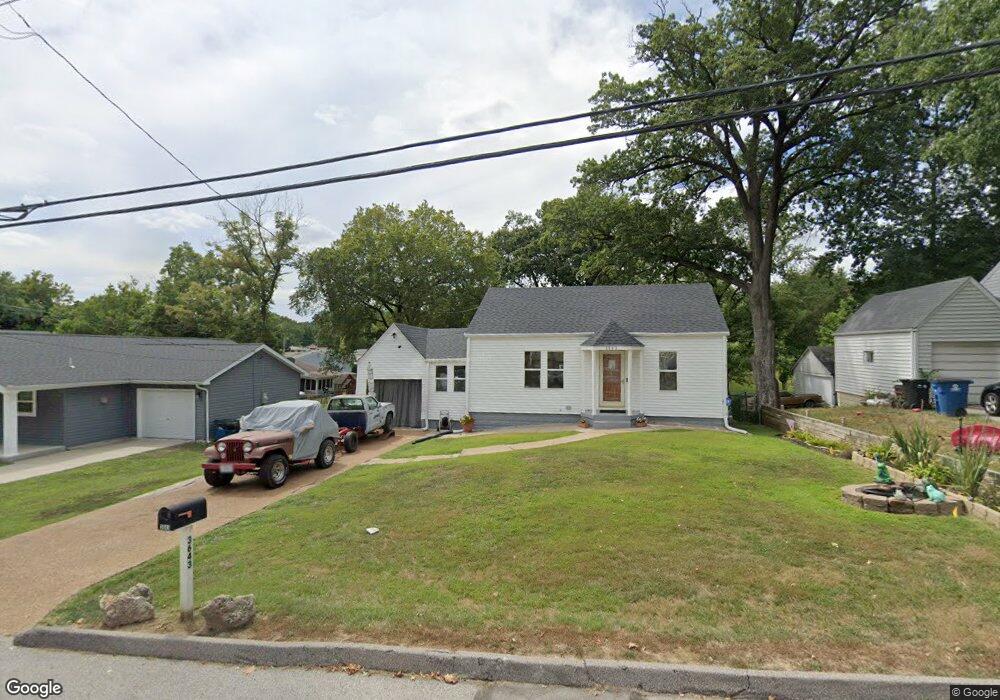
3643 Connor Ave Saint Louis, MO 63121
Estimated Value: $90,000 - $129,000
2
Beds
1
Bath
840
Sq Ft
$129/Sq Ft
Est. Value
About This Home
This home is located at 3643 Connor Ave, Saint Louis, MO 63121 and is currently estimated at $108,623, approximately $129 per square foot. 3643 Connor Ave is a home located in St. Louis County with nearby schools including Marvin Elementary School, Ritenour Middle School, and Ritenour Senior High School.
Ownership History
Date
Name
Owned For
Owner Type
Purchase Details
Closed on
Jan 25, 2022
Sold by
Smith Diana D
Bought by
Smith Michael A and Smith Diana D
Current Estimated Value
Purchase Details
Closed on
Dec 28, 2021
Sold by
Smith Diana D
Bought by
Smith Michael A and Smith Diana D
Purchase Details
Closed on
Sep 1, 2010
Sold by
Smith Michael A
Bought by
Smith Diann D
Purchase Details
Closed on
Jul 29, 1999
Sold by
Golden Delta Enterprises Inc
Bought by
Brinton William R and Security Investment Inc
Home Financials for this Owner
Home Financials are based on the most recent Mortgage that was taken out on this home.
Original Mortgage
$48,200
Interest Rate
7.71%
Mortgage Type
Purchase Money Mortgage
Purchase Details
Closed on
Apr 2, 1999
Sold by
Mccandles Doyle W and Mccandles Paula M
Bought by
St Louis Postal Credit Union
Purchase Details
Closed on
Nov 25, 1998
Sold by
Mccandless Doyle W and Mccandless Paula M
Bought by
Mccandless Doyle W
Create a Home Valuation Report for This Property
The Home Valuation Report is an in-depth analysis detailing your home's value as well as a comparison with similar homes in the area
Home Values in the Area
Average Home Value in this Area
Purchase History
| Date | Buyer | Sale Price | Title Company |
|---|---|---|---|
| Smith Michael A | -- | None Listed On Document | |
| Smith Michael A | -- | None Listed On Document | |
| Smith Diann D | -- | Capital Title | |
| Brinton William R | $25,500 | Capital Title | |
| Golden Delta Enterprises Inc | $20,600 | Capital Title | |
| St Louis Postal Credit Union | $20,000 | -- | |
| Mccandless Doyle W | -- | -- |
Source: Public Records
Mortgage History
| Date | Status | Borrower | Loan Amount |
|---|---|---|---|
| Previous Owner | Brinton William R | $48,200 |
Source: Public Records
Tax History Compared to Growth
Tax History
| Year | Tax Paid | Tax Assessment Tax Assessment Total Assessment is a certain percentage of the fair market value that is determined by local assessors to be the total taxable value of land and additions on the property. | Land | Improvement |
|---|---|---|---|---|
| 2025 | $1,487 | $25,270 | $6,350 | $18,920 |
| 2024 | $1,487 | $16,470 | $3,420 | $13,050 |
| 2023 | $1,533 | $16,470 | $3,420 | $13,050 |
| 2022 | $1,311 | $12,120 | $2,430 | $9,690 |
| 2021 | $1,274 | $12,120 | $2,430 | $9,690 |
| 2020 | $955 | $8,400 | $2,110 | $6,290 |
| 2019 | $941 | $8,400 | $2,110 | $6,290 |
| 2018 | $1,084 | $9,070 | $1,960 | $7,110 |
| 2017 | $1,084 | $9,070 | $1,960 | $7,110 |
| 2016 | $1,161 | $9,830 | $1,960 | $7,870 |
| 2015 | $1,157 | $9,830 | $1,960 | $7,870 |
| 2014 | $1,172 | $9,810 | $3,310 | $6,500 |
Source: Public Records
Map
Nearby Homes
- 495 Ginger Dr
- 493 Ginger Dr
- 4004 Engler Ave
- 8950 Higginson Dr
- 8922 Higginson Dr
- 2965 Kincaid Ave
- 8950 Natural Bridge Rd
- 8687 Belhaven Dr
- 4217 Springdale Ave
- 4254 Stambaugh Ct
- 8718 Mavis Place
- 2918 Ridgeway Ave
- 9163 Loganberry Ln
- 2915 Ridgeway Ave
- 8728 Susan Ave
- 8836 Ramona Ave
- 4323 Rickey Dr
- 2835 Walton Rd
- 3436 Saint Henry Ln
- 9029 Cranberry Ln
- 3647 Connor Ave
- 3637 Connor Ave
- 3635 Connor Ave
- 9154 Wood Ave
- 3701 Connor Ave
- 3633 Connor Ave
- 9215 Outerbelt Ct
- 3717 Connor Ave
- 9158 Wood Ave
- 3631 Connor Ave
- 9221 Outerbelt Ct
- 9151 Wood Ave
- 3632 Connor Ave
- 9150 Wood Ave
- 3721 Connor Ave
- 9223 Outerbelt Ct
- 9146 Wood Ave
- 9145 Wood Ave
- 3564 Valleywood Dr
- 3568 Valleywood Dr