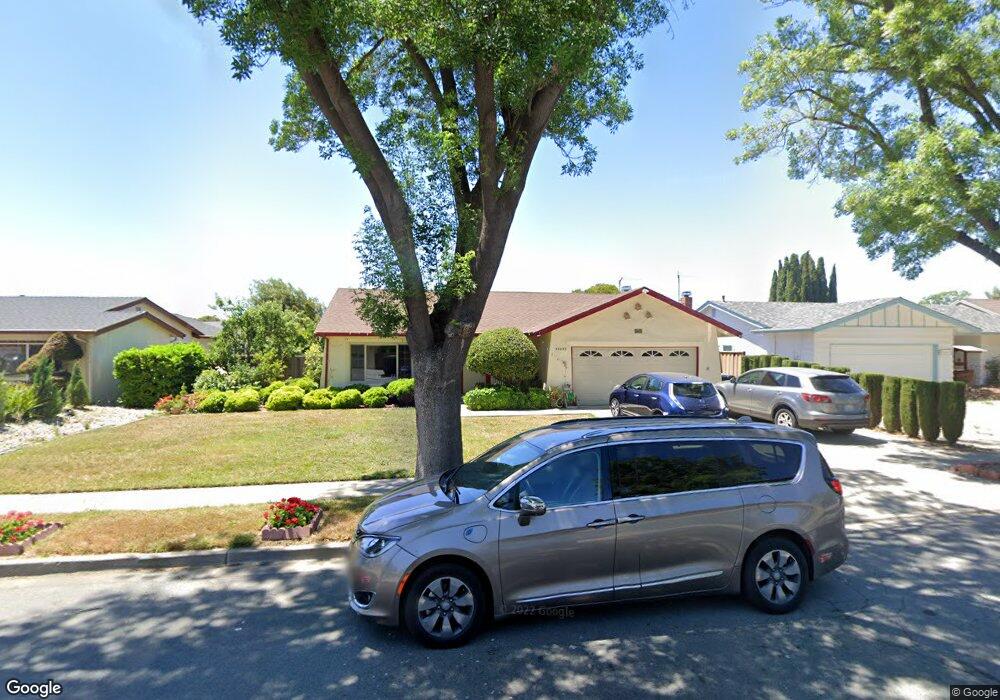
36435 Cypress Point Dr Newark, CA 94560
Estimated Value: $1,363,000 - $1,458,859
3
Beds
2
Baths
1,482
Sq Ft
$958/Sq Ft
Est. Value
About This Home
This home is located at 36435 Cypress Point Dr, Newark, CA 94560 and is currently estimated at $1,419,215, approximately $957 per square foot. 36435 Cypress Point Dr is a home located in Alameda County with nearby schools including Lincoln Elementary School, Newark Junior High School, and Newark Memorial High School.
Ownership History
Date
Name
Owned For
Owner Type
Purchase Details
Closed on
Mar 14, 2018
Sold by
Ramasamy Vasu and Vasu Mahalakshmi
Bought by
Ramasamy Vasu and Vasu Mahalakshmi
Current Estimated Value
Purchase Details
Closed on
Nov 20, 2002
Sold by
Ramasamy Vasu
Bought by
Ramasamy Vasu and Vasu Mahalakshmi
Purchase Details
Closed on
May 10, 2002
Sold by
Vasu Mahalakshmi
Bought by
Ramasamy Vasu
Home Financials for this Owner
Home Financials are based on the most recent Mortgage that was taken out on this home.
Original Mortgage
$372,000
Outstanding Balance
$156,640
Interest Rate
6.89%
Estimated Equity
$1,262,575
Purchase Details
Closed on
Jun 19, 2001
Sold by
Gaddy Armon T and Gaddy Barbara A
Bought by
Gaddy Armon T and Gaddy Barbara A
Create a Home Valuation Report for This Property
The Home Valuation Report is an in-depth analysis detailing your home's value as well as a comparison with similar homes in the area
Home Values in the Area
Average Home Value in this Area
Purchase History
| Date | Buyer | Sale Price | Title Company |
|---|---|---|---|
| Ramasamy Vasu | -- | None Available | |
| Ramasamy Vasu | -- | -- | |
| Ramasamy Vasu | -- | American Title Co | |
| Ramasamy Vasu | $465,000 | American Title Co | |
| Gaddy Armon T | -- | -- |
Source: Public Records
Mortgage History
| Date | Status | Borrower | Loan Amount |
|---|---|---|---|
| Open | Ramasamy Vasu | $372,000 | |
| Closed | Ramasamy Vasu | $46,200 |
Source: Public Records
Tax History Compared to Growth
Tax History
| Year | Tax Paid | Tax Assessment Tax Assessment Total Assessment is a certain percentage of the fair market value that is determined by local assessors to be the total taxable value of land and additions on the property. | Land | Improvement |
|---|---|---|---|---|
| 2025 | $8,865 | $717,081 | $206,069 | $518,012 |
| 2024 | $8,865 | $702,885 | $202,029 | $507,856 |
| 2023 | $8,624 | $695,969 | $198,069 | $497,900 |
| 2022 | $8,516 | $675,323 | $194,185 | $488,138 |
| 2021 | $8,302 | $661,946 | $190,378 | $478,568 |
| 2020 | $7,798 | $628,088 | $188,426 | $439,662 |
| 2019 | $7,686 | $615,775 | $184,732 | $431,043 |
| 2018 | $7,571 | $603,704 | $181,111 | $422,593 |
| 2017 | $7,378 | $591,870 | $177,561 | $414,309 |
| 2016 | $7,302 | $580,268 | $174,080 | $406,188 |
| 2015 | $7,277 | $571,554 | $171,466 | $400,088 |
| 2014 | $6,836 | $540,000 | $162,000 | $378,000 |
Source: Public Records
Map
Nearby Homes
- 7574 Birkdale Dr
- 36184 Toulouse St
- 36563 Beutke Dr
- 36466 Haley St
- 35914 Burning Tree Dr
- 36985 Walnut St
- 36535 Mulberry St
- 37051 Walnut St
- 6831 Cabernet Ave
- 36075 Crystal Springs Dr
- 7843 Railroad Ave
- 36702 Olive St
- 36523 Cherry St
- 6875 Normandy Dr
- 6793 Flanders Dr
- 36593 Leone St
- 6364 Noel Ave
- 6588 Flanders Dr
- 37356 Suncrest St
- 36976 Mulberry St
- 36411 Cypress Point Dr
- 36461 Cypress Point Dr
- 36399 Shorehaven Place
- 36396 Shorehaven Place
- 36475 Cypress Point Dr
- 36389 Cypress Point Dr
- 36434 Cypress Point Dr
- 36377 Shorehaven Place
- 36458 Cypress Point Dr
- 36420 Cypress Point Dr
- 36371 Cypress Point Dr
- 36472 Cypress Point Dr
- 36372 Shorehaven Place
- 36470 Spruce St
- 36482 Spruce St
- 36406 Cypress Point Dr
- 36353 Cypress Point Dr
- 36365 Shorehaven Place
- 36484 Cypress Point Dr
- 36394 Cypress Point Dr