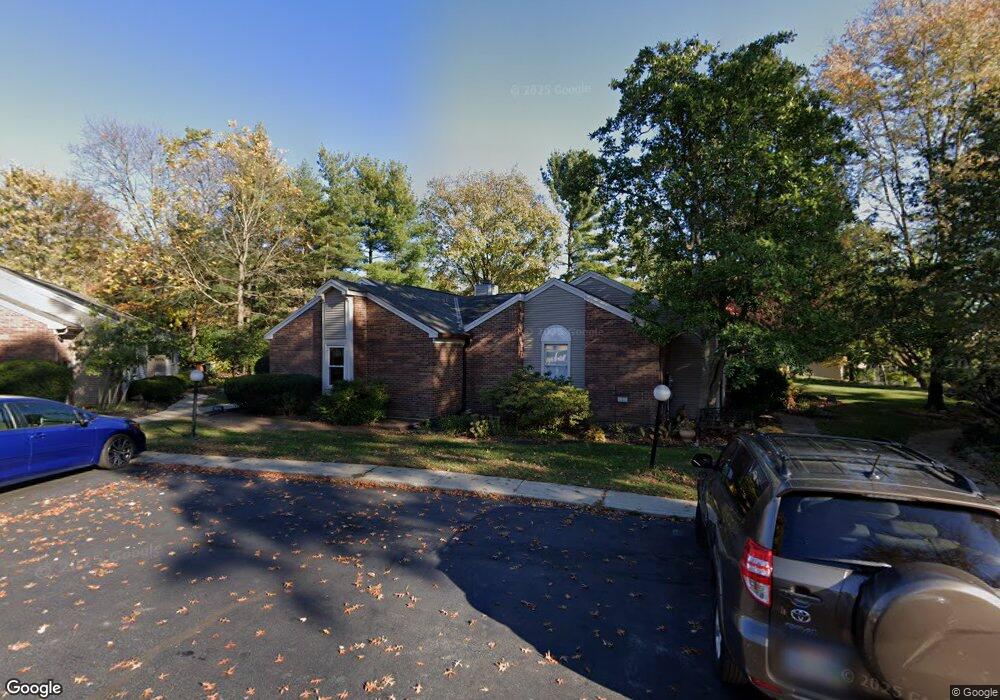
3644 Parfore Ct Cincinnati, OH 45245
Estimated Value: $159,115 - $183,000
2
Beds
2
Baths
1,086
Sq Ft
$162/Sq Ft
Est. Value
About This Home
This home is located at 3644 Parfore Ct, Cincinnati, OH 45245 and is currently estimated at $175,779, approximately $161 per square foot. 3644 Parfore Ct is a home located in Clermont County with nearby schools including Merwin Elementary School, West Clermont Middle School, and West Clermont High School.
Ownership History
Date
Name
Owned For
Owner Type
Purchase Details
Closed on
Jun 16, 2021
Sold by
Norgren Janet H
Bought by
Dilger Matthew L and Norgren Suzette R
Current Estimated Value
Purchase Details
Closed on
Aug 20, 1998
Sold by
Maynard Michael K
Bought by
Norgren Ernest B and Norgren Janet H
Home Financials for this Owner
Home Financials are based on the most recent Mortgage that was taken out on this home.
Original Mortgage
$29,900
Outstanding Balance
$6,276
Interest Rate
6.99%
Mortgage Type
New Conventional
Estimated Equity
$169,503
Purchase Details
Closed on
Apr 26, 1995
Sold by
Hunter Jerry L
Bought by
Maynard Michael K and Maynard Elizabeth A
Purchase Details
Closed on
Apr 1, 1988
Create a Home Valuation Report for This Property
The Home Valuation Report is an in-depth analysis detailing your home's value as well as a comparison with similar homes in the area
Purchase History
| Date | Buyer | Sale Price | Title Company |
|---|---|---|---|
| Dilger Matthew L | -- | None Available | |
| Norgren Ernest B | $90,900 | -- | |
| Maynard Michael K | $79,500 | -- | |
| -- | $64,000 | -- |
Source: Public Records
Mortgage History
| Date | Status | Borrower | Loan Amount |
|---|---|---|---|
| Open | Norgren Ernest B | $29,900 |
Source: Public Records
Tax History
| Year | Tax Paid | Tax Assessment Tax Assessment Total Assessment is a certain percentage of the fair market value that is determined by local assessors to be the total taxable value of land and additions on the property. | Land | Improvement |
|---|---|---|---|---|
| 2024 | $2,362 | $45,160 | $7,740 | $37,420 |
| 2023 | $2,365 | $45,160 | $7,740 | $37,420 |
| 2022 | $1,846 | $30,660 | $5,250 | $25,410 |
| 2021 | $1,274 | $30,660 | $5,250 | $25,410 |
| 2020 | $1,275 | $30,660 | $5,250 | $25,410 |
| 2019 | $1,088 | $29,060 | $1,580 | $27,480 |
| 2018 | $1,099 | $29,060 | $1,580 | $27,480 |
| 2017 | $1,113 | $29,060 | $1,580 | $27,480 |
| 2016 | $1,014 | $25,730 | $1,400 | $24,330 |
| 2015 | $951 | $25,730 | $1,400 | $24,330 |
| 2014 | $951 | $25,730 | $1,400 | $24,330 |
| 2013 | $1,043 | $27,270 | $1,790 | $25,480 |
Source: Public Records
Map
Nearby Homes
- 1019 Cedar Ridge Dr
- 971 Cedar Ridge Dr
- 3806 Sturbridge Way
- 3807 Sturbridge Way
- 1013 Prestwick Place
- 3894 Kippling Crossing
- 1068 Terrydel Ln
- 3826 Sturbridge Way
- 3775 Prestwick Cir
- 1101 Will-O-ee Dr
- 0 Merwin Ten Mile Rd Unit 1872009
- 3653 Legend Oaks Dr
- 3726 Oakwood Dr
- 3566 Turnberry
- 1204 Buxton Oaks Dr
- 1205 Buxton Oaks Dr
- 6451 Braewing Ct
- 3858 Heritage Oaks Dr
- 3815 Lilac Ln
- 854 Country Club Dr
- 3646 Parfore Ct
- 3642 Parfore Ct
- 3648 Parfore Ct
- 3640 Parfore Ct
- 3650 Parfore Ct
- 3638 Parfore Ct
- 3652 Parfore Ct
- 3654 Parfore Ct
- 3636 Parfore Ct
- 3634 Parfore Ct
- 3632 Parfore Ct
- 3658 Parfore Ct
- 3660 Parfore Ct
- 3662 Parfore Ct
- 3692 Parfore Ct Unit 13
- 3688 Parfore Ct Unit 15
- 3694 Parfore Ct Unit 12
- 3686 Parfore Ct
- 3696 Parfore Ct
- 1017 Cedar Ridge Dr
Your Personal Tour Guide
Ask me questions while you tour the home.