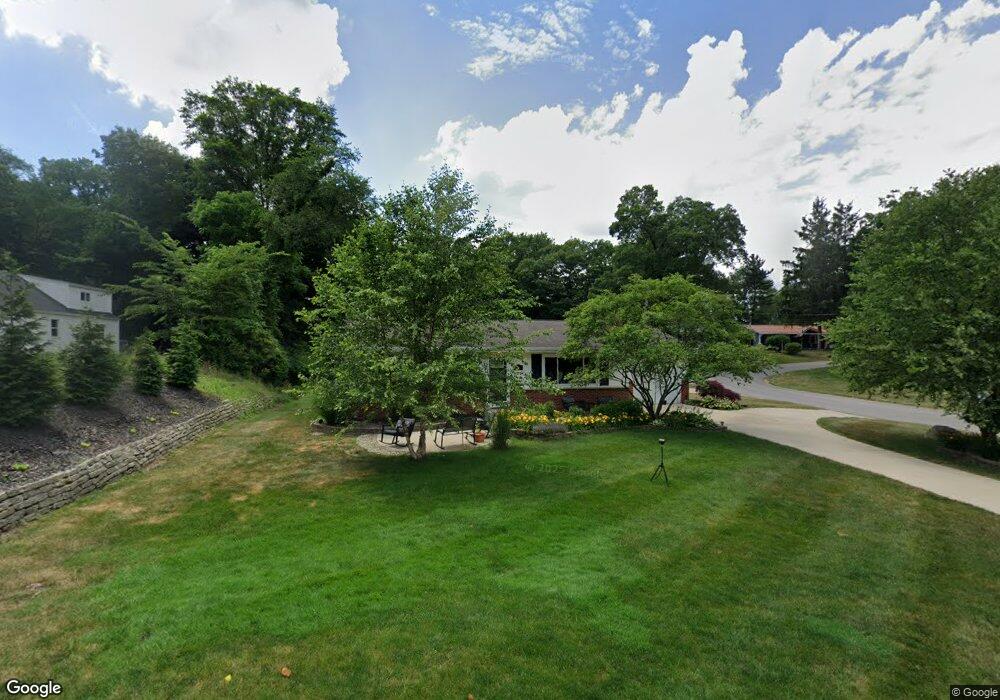
3645 Colonial Ave NE Grand Rapids, MI 49525
Northview NeighborhoodEstimated Value: $316,423 - $359,000
--
Bed
--
Bath
--
Sq Ft
0.56
Acres
About This Home
This home is located at 3645 Colonial Ave NE, Grand Rapids, MI 49525 and is currently estimated at $342,606. 3645 Colonial Ave NE is a home located in Kent County with nearby schools including West Oakview Elementary School, North Oakview Elementary School, and East Oakview Elementary School.
Ownership History
Date
Name
Owned For
Owner Type
Purchase Details
Closed on
Sep 4, 2024
Sold by
Vanderjagt Laurie and Bajema Laurie
Bought by
Vanderjagt Laurie
Current Estimated Value
Purchase Details
Closed on
Feb 14, 2020
Sold by
Vanderhagt Matthew
Bought by
Bajema Laurie
Home Financials for this Owner
Home Financials are based on the most recent Mortgage that was taken out on this home.
Original Mortgage
$237,500
Interest Rate
3.6%
Mortgage Type
New Conventional
Purchase Details
Closed on
Apr 26, 2016
Sold by
Vanderjagt Ashley
Bought by
Vanderjagt Matthew
Purchase Details
Closed on
Jan 18, 2013
Sold by
Clark Ellen Lee and Vanderjagt Arthur B
Bought by
Vanderjagt Matthew J and Vanderjagt Ashely L
Home Financials for this Owner
Home Financials are based on the most recent Mortgage that was taken out on this home.
Original Mortgage
$94,000
Interest Rate
2.64%
Mortgage Type
New Conventional
Purchase Details
Closed on
Feb 28, 2012
Sold by
Vanderjagt Flora
Bought by
Clark Ellen and Vanderjagt Wayne D
Create a Home Valuation Report for This Property
The Home Valuation Report is an in-depth analysis detailing your home's value as well as a comparison with similar homes in the area
Home Values in the Area
Average Home Value in this Area
Purchase History
| Date | Buyer | Sale Price | Title Company |
|---|---|---|---|
| Vanderjagt Laurie | -- | None Listed On Document | |
| Bajema Laurie | $250,000 | First American Title Ins Co | |
| Vanderjagt Matthew | -- | Attorney | |
| Vanderjagt Matthew J | $117,500 | Sun Title Agency Of Mi Llc | |
| Clark Ellen | -- | None Available |
Source: Public Records
Mortgage History
| Date | Status | Borrower | Loan Amount |
|---|---|---|---|
| Previous Owner | Bajema Laurie | $237,500 | |
| Previous Owner | Vanderjagt Matthew J | $94,000 |
Source: Public Records
Tax History Compared to Growth
Tax History
| Year | Tax Paid | Tax Assessment Tax Assessment Total Assessment is a certain percentage of the fair market value that is determined by local assessors to be the total taxable value of land and additions on the property. | Land | Improvement |
|---|---|---|---|---|
| 2025 | $2,281 | $153,400 | $0 | $0 |
| 2024 | $2,281 | $127,400 | $0 | $0 |
| 2023 | $2,182 | $103,900 | $0 | $0 |
| 2022 | $3,218 | $97,300 | $0 | $0 |
| 2021 | $3,088 | $92,800 | $0 | $0 |
| 2020 | $1,162 | $76,700 | $0 | $0 |
| 2019 | $1,780 | $72,100 | $0 | $0 |
| 2018 | $1,743 | $65,000 | $0 | $0 |
| 2017 | $1,698 | $60,000 | $0 | $0 |
| 2016 | $1,641 | $55,000 | $0 | $0 |
| 2015 | $1,623 | $55,000 | $0 | $0 |
| 2013 | -- | $46,500 | $0 | $0 |
Source: Public Records
Map
Nearby Homes
- 3776 Eastern Ave NE
- 3836 Standish Ave NE
- 1030 4 Mile Rd NE
- 3649 Coit Ave NE
- 4005 Filkins Dr NE
- 3544 Briggs Blvd NE
- 3750 Benjamin Ave NE
- 3261 Essex St NE
- 1444 Mark St NE
- 3785 Willow Dr NE
- 3903 Willow Dr NE
- 3661 Willow Dr NE
- 408 Elmdale St NE
- 3151 Kendalwood Ct NE
- 3030 Plainfield Ave NE
- 1710 Kreft St NE
- 2905 Remy Ct NE Unit 1
- 4148 Chadwick Ave NE
- 1860 Kreft St NE
- 1985 Oakcliff Dr NE
- 3637 Colonial Ave NE
- 3705 Standish Ave NE
- 3720 Standish Ave NE
- 3625 Colonial Ave NE
- 3721 Standish Ave NE
- 3701 Stuyvesant Ave NE
- 3636 Colonial Ave NE
- 3708 Williamson Ave NE
- 3619 Colonial Ave NE
- 3617 Colonial Ave NE
- 3735 Standish Ave NE
- 3705 Stuyvesant Ave NE
- 3712 Williamson Ave NE
- 3624 Colonial Ave NE
- 3615 Colonial Ave NE
- 3742 Standish Ave NE
- 3728 Williamson Ave NE
- 3755 Stuyvesant Ave NE
- 3745 Standish Ave NE
- 859 4 Mile Rd NE