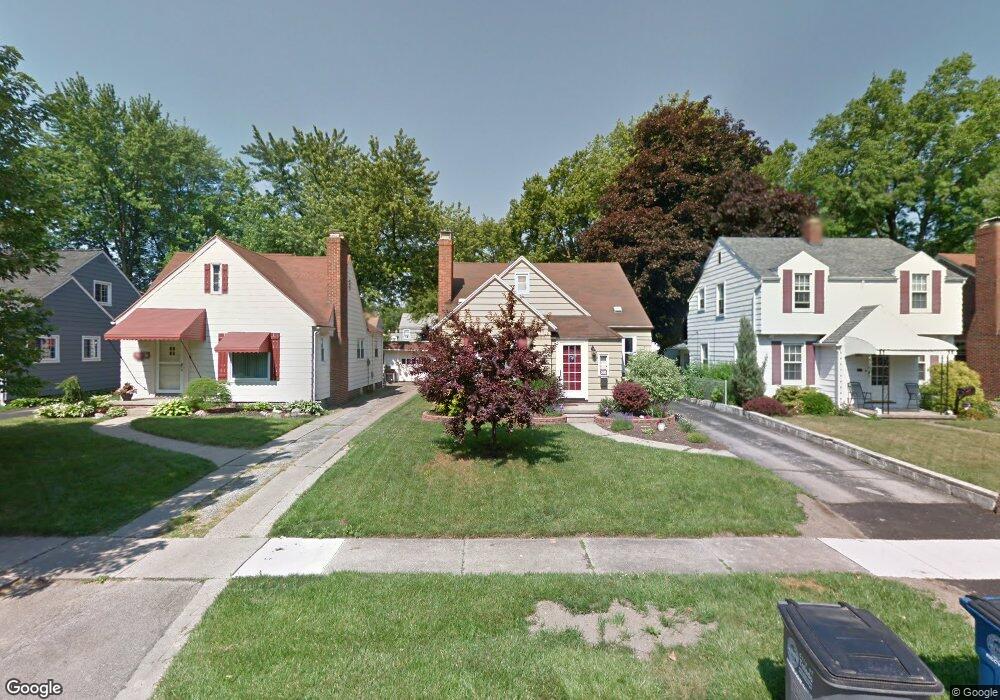
3645 Kershaw Ave Toledo, OH 43613
DeVeaux NeighborhoodEstimated Value: $147,000 - $162,000
3
Beds
1
Bath
1,309
Sq Ft
$118/Sq Ft
Est. Value
About This Home
This home is located at 3645 Kershaw Ave, Toledo, OH 43613 and is currently estimated at $154,147, approximately $117 per square foot. 3645 Kershaw Ave is a home located in Lucas County with nearby schools including DeVeaux Elementary School, Start High School, and Horizon Science Academy - Toledo High School.
Ownership History
Date
Name
Owned For
Owner Type
Purchase Details
Closed on
Dec 8, 2009
Sold by
Hall Robert P and Hall Suzanne E
Bought by
Hall Suzanne E
Current Estimated Value
Purchase Details
Closed on
Nov 17, 2004
Sold by
Daniels Todd M and Daniels Rachelle L
Bought by
Hall Robert P and Hall Suzanne E
Home Financials for this Owner
Home Financials are based on the most recent Mortgage that was taken out on this home.
Original Mortgage
$109,000
Outstanding Balance
$53,377
Interest Rate
5.5%
Mortgage Type
Purchase Money Mortgage
Estimated Equity
$100,770
Purchase Details
Closed on
Jan 31, 2002
Sold by
Andrea Barr and Kamin Andrea
Bought by
Daniels Todd M and Daniels Rachelle L
Home Financials for this Owner
Home Financials are based on the most recent Mortgage that was taken out on this home.
Original Mortgage
$83,940
Interest Rate
7.26%
Mortgage Type
FHA
Purchase Details
Closed on
Apr 24, 2001
Sold by
Kamin Randal
Bought by
Kamin Andrea and Barr Andrea
Create a Home Valuation Report for This Property
The Home Valuation Report is an in-depth analysis detailing your home's value as well as a comparison with similar homes in the area
Home Values in the Area
Average Home Value in this Area
Purchase History
| Date | Buyer | Sale Price | Title Company |
|---|---|---|---|
| Hall Suzanne E | -- | Attorney | |
| Hall Robert P | $109,000 | -- | |
| Daniels Todd M | $90,700 | Northwest Title Agency Of Oh | |
| Kamin Andrea | -- | -- |
Source: Public Records
Mortgage History
| Date | Status | Borrower | Loan Amount |
|---|---|---|---|
| Open | Hall Robert P | $109,000 | |
| Previous Owner | Daniels Todd M | $83,940 |
Source: Public Records
Tax History Compared to Growth
Tax History
| Year | Tax Paid | Tax Assessment Tax Assessment Total Assessment is a certain percentage of the fair market value that is determined by local assessors to be the total taxable value of land and additions on the property. | Land | Improvement |
|---|---|---|---|---|
| 2024 | $1,164 | $38,010 | $8,015 | $29,995 |
| 2023 | $2,082 | $32,480 | $7,105 | $25,375 |
| 2022 | $2,071 | $32,480 | $7,105 | $25,375 |
| 2021 | $2,185 | $32,480 | $7,105 | $25,375 |
| 2020 | $2,069 | $27,055 | $5,880 | $21,175 |
| 2019 | $2,010 | $27,055 | $5,880 | $21,175 |
| 2018 | $2,084 | $27,055 | $5,880 | $21,175 |
| 2017 | $2,051 | $26,425 | $5,740 | $20,685 |
| 2016 | $2,045 | $75,500 | $16,400 | $59,100 |
| 2015 | $2,065 | $75,500 | $16,400 | $59,100 |
| 2014 | $1,708 | $26,430 | $5,740 | $20,690 |
| 2013 | $1,708 | $26,430 | $5,740 | $20,690 |
Source: Public Records
Map
Nearby Homes
- 3540 Kershaw Ave
- 3560 Bellevue Rd
- 3656 Bellevue Rd
- 3621 Sherbrooke Rd
- 2426 Berdan Ave
- 2433 Georgetown Ave
- 2220 Beaufort Ave
- 3512 Wyckliffe Pkwy
- 2447 Portsmouth Ave
- 2513 Portsmouth Ave
- 2146 Marlow Rd
- 3512 Rushland Ave
- 3715 Shelbourne Ave
- 3350 Wyckliffe Pkwy
- 3251 Northwood Ave
- 2106 Fairfax Rd
- 2560 Charlestown Ave
- 3306 Saint Bernard Dr
- 2050 Berdan Ave
- 4015 Roanoke Rd
- 3635 Kershaw Ave
- 3627 Kershaw Ave
- 3639 Kershaw Ave
- 3641 Kershaw Ave
- 3623 Kershaw Ave
- 3636 Anderson Pkwy
- 3632 Anderson Pkwy
- 3619 Kershaw Ave
- 3640 Anderson Pkwy
- 3628 Anderson Pkwy
- 3644 Anderson Pkwy
- 3651 Kershaw Ave
- 3624 Anderson Pkwy
- 3615 Kershaw Ave
- 3648 Anderson Pkwy
- 3620 Anderson Pkwy
- 3636 Kershaw Ave
- 3640 Kershaw Ave
- 3655 Kershaw Ave
- 3644 Kershaw Ave