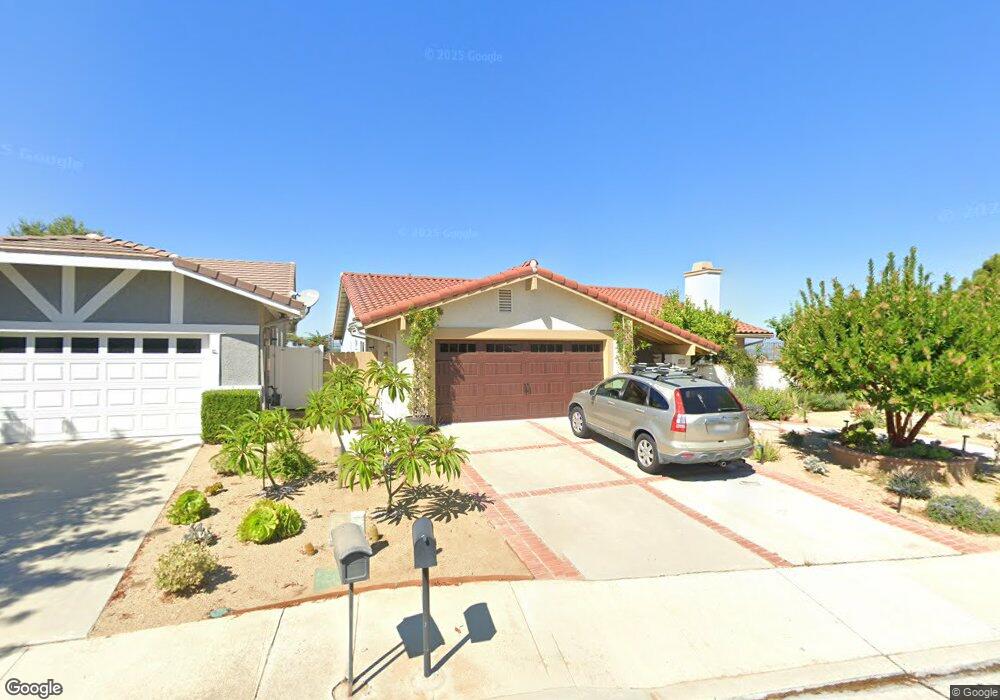
3645 Raincloud Ct Thousand Oaks, CA 91362
Estimated Value: $1,061,000 - $1,181,978
4
Beds
2
Baths
2,139
Sq Ft
$523/Sq Ft
Est. Value
About This Home
This home is located at 3645 Raincloud Ct, Thousand Oaks, CA 91362 and is currently estimated at $1,117,745, approximately $522 per square foot. 3645 Raincloud Ct is a home located in Ventura County with nearby schools including Weathersfield Elementary School, Los Cerritos Middle School, and Thousand Oaks High School.
Ownership History
Date
Name
Owned For
Owner Type
Purchase Details
Closed on
Sep 24, 2010
Sold by
Caffrey John Timothy and Caffrey Terese Marie
Bought by
Caffrey John Timothy and Caffrey Terese Marie
Current Estimated Value
Home Financials for this Owner
Home Financials are based on the most recent Mortgage that was taken out on this home.
Original Mortgage
$682,993
Outstanding Balance
$452,373
Interest Rate
4.5%
Mortgage Type
FHA
Estimated Equity
$665,372
Purchase Details
Closed on
Dec 27, 2007
Sold by
Caffrey John T and Caffrey Terese M
Bought by
Caffrey John Timothy and Caffrey Terese Marie
Purchase Details
Closed on
Jul 19, 2007
Sold by
Wiedlin Robert A
Bought by
Caffrey John T and Caffrey Terese M
Home Financials for this Owner
Home Financials are based on the most recent Mortgage that was taken out on this home.
Original Mortgage
$136,000
Interest Rate
6.38%
Mortgage Type
Stand Alone Second
Create a Home Valuation Report for This Property
The Home Valuation Report is an in-depth analysis detailing your home's value as well as a comparison with similar homes in the area
Purchase History
| Date | Buyer | Sale Price | Title Company |
|---|---|---|---|
| Caffrey John Timothy | -- | Ticor Title Company | |
| Caffrey John Timothy | -- | None Available | |
| Caffrey John T | $680,000 | Equity Title Company |
Source: Public Records
Mortgage History
| Date | Status | Borrower | Loan Amount |
|---|---|---|---|
| Open | Caffrey John Timothy | $682,993 | |
| Closed | Caffrey John T | $136,000 | |
| Closed | Caffrey John T | $544,000 |
Source: Public Records
Tax History
| Year | Tax Paid | Tax Assessment Tax Assessment Total Assessment is a certain percentage of the fair market value that is determined by local assessors to be the total taxable value of land and additions on the property. | Land | Improvement |
|---|---|---|---|---|
| 2025 | $10,065 | $893,176 | $580,568 | $312,608 |
| 2024 | $10,065 | $875,663 | $569,184 | $306,479 |
| 2023 | $9,779 | $858,494 | $558,024 | $300,470 |
| 2022 | $9,594 | $841,661 | $547,082 | $294,579 |
| 2021 | $9,412 | $825,158 | $536,355 | $288,803 |
| 2020 | $8,930 | $816,699 | $530,856 | $285,843 |
| 2019 | $7,780 | $713,000 | $464,000 | $249,000 |
| 2018 | $7,297 | $668,000 | $435,000 | $233,000 |
| 2017 | $7,338 | $673,000 | $438,000 | $235,000 |
| 2016 | $6,771 | $613,000 | $399,000 | $214,000 |
| 2015 | $6,673 | $606,000 | $394,000 | $212,000 |
| 2014 | $5,791 | $520,000 | $338,000 | $182,000 |
Source: Public Records
Map
Nearby Homes
- 3618 Raincloud Ct
- 3434 Fayance Place
- 2136 Mccrea Rd
- 3752 Corte de Los Reyes
- 3225 Futura Point
- 3671 Mapleknoll Place
- 3683 Mapleknoll Place
- 3182 Toulouse Cir
- 4054 Corte Cima
- 2225 Calle Riscoso
- 4064 Lemonberry Place
- 1401 Calle de Oro
- 1638 Sweet Briar Place
- 1546 Holly Ct
- 3374 Larkhaven Ct
- 1541 Eucalyptus Cir
- 1915 Woodside Dr
- 3156 Boxwood Cir
- 3542 N Avenida Montuoso
- 1771 Calle Artigas
- 3633 Raincloud Ct
- 3621 Raincloud Ct
- 3630 Raincloud Ct
- 3609 Raincloud Ct
- 3644 Raincloud Ct
- 3595 Raincloud Ct
- 3625 Sunset Knolls Dr
- 3709 Sunset Knolls Dr
- 3682 Sunset Knolls Dr
- 3668 Sunset Knolls Dr
- 3594 Raincloud Ct
- 3696 Sunset Knolls Dr
- 3654 Sunset Knolls Dr
- 3611 Sunset Knolls Dr
- 3585 Raincloud Ct
- 3710 Sunset Knolls Dr
- 3640 Sunset Knolls Dr
- 3582 Raincloud Ct
- 3597 Sunset Knolls Dr
- 3723 Sunset Knolls Dr
Your Personal Tour Guide
Ask me questions while you tour the home.