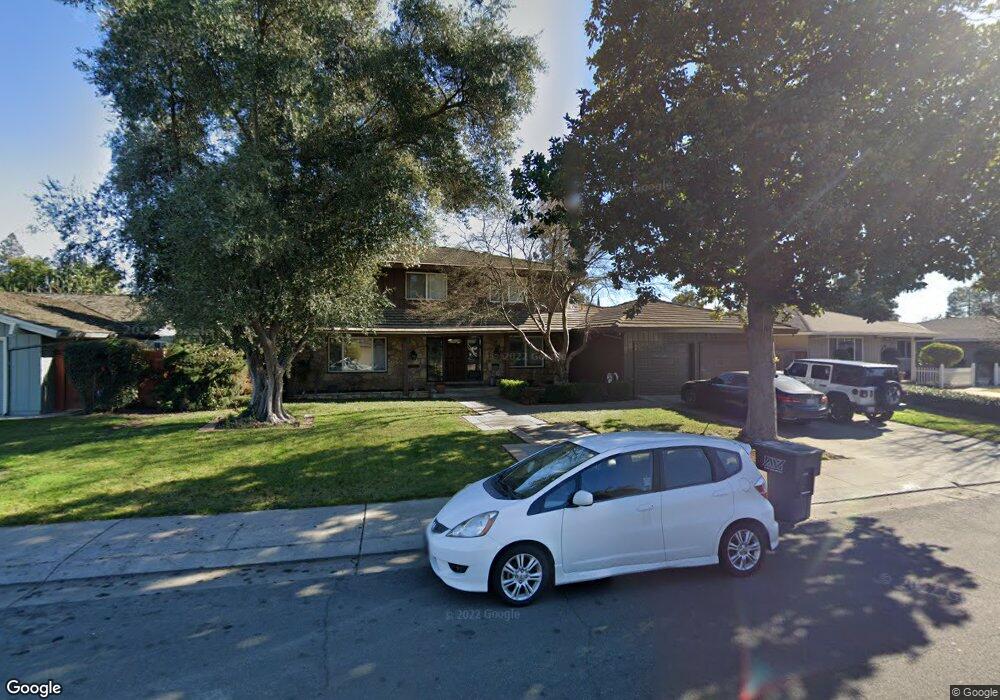
3646 N Monitor Cir Stockton, CA 95219
Lincoln Village West NeighborhoodEstimated Value: $591,448 - $641,000
4
Beds
2
Baths
2,140
Sq Ft
$286/Sq Ft
Est. Value
About This Home
This home is located at 3646 N Monitor Cir, Stockton, CA 95219 and is currently estimated at $612,112, approximately $286 per square foot. 3646 N Monitor Cir is a home located in San Joaquin County with nearby schools including Mable Barron, Sierra Middle School, and Lincoln High School.
Ownership History
Date
Name
Owned For
Owner Type
Purchase Details
Closed on
Jun 4, 2024
Sold by
Delfatti Jon F and Delfatti Lynn A
Bought by
Delfatti Family 2024 Revocable Trust and Delfatti
Current Estimated Value
Purchase Details
Closed on
Jun 22, 2015
Sold by
Delfatti Jon F and Delfatti Lynn A
Bought by
Delfatti Jon and Delfatti Lynn
Home Financials for this Owner
Home Financials are based on the most recent Mortgage that was taken out on this home.
Original Mortgage
$340,000
Interest Rate
3.81%
Mortgage Type
New Conventional
Purchase Details
Closed on
Nov 5, 2013
Sold by
Jones Francie J and Francie J Jones Revocable Trus
Bought by
Delfatti Jon F and Delfatti Lynn A
Home Financials for this Owner
Home Financials are based on the most recent Mortgage that was taken out on this home.
Original Mortgage
$323,600
Interest Rate
3.37%
Mortgage Type
Adjustable Rate Mortgage/ARM
Purchase Details
Closed on
Apr 1, 1996
Sold by
Jones Francie
Bought by
Jones Francie
Create a Home Valuation Report for This Property
The Home Valuation Report is an in-depth analysis detailing your home's value as well as a comparison with similar homes in the area
Home Values in the Area
Average Home Value in this Area
Purchase History
| Date | Buyer | Sale Price | Title Company |
|---|---|---|---|
| Delfatti Family 2024 Revocable Trust | -- | None Listed On Document | |
| Delfatti Jon | -- | North American Title Co Inc | |
| Delfatti Jon F | -- | Old Republic Title Company | |
| Jones Francie | -- | Fidelity National Title Co |
Source: Public Records
Mortgage History
| Date | Status | Borrower | Loan Amount |
|---|---|---|---|
| Previous Owner | Delfatti Jon | $315,300 | |
| Previous Owner | Delfatti Jon | $60,000 | |
| Previous Owner | Delfatti Jon | $340,000 | |
| Previous Owner | Delfatti Jon F | $323,600 |
Source: Public Records
Tax History Compared to Growth
Tax History
| Year | Tax Paid | Tax Assessment Tax Assessment Total Assessment is a certain percentage of the fair market value that is determined by local assessors to be the total taxable value of land and additions on the property. | Land | Improvement |
|---|---|---|---|---|
| 2024 | $5,297 | $432,649 | $151,425 | $281,224 |
| 2023 | $5,278 | $424,166 | $148,456 | $275,710 |
| 2022 | $4,892 | $415,850 | $145,546 | $270,304 |
| 2021 | $4,828 | $407,697 | $142,693 | $265,004 |
| 2020 | $4,826 | $403,517 | $141,230 | $262,287 |
| 2019 | $4,751 | $395,606 | $138,461 | $257,145 |
| 2018 | $4,669 | $387,850 | $135,747 | $252,103 |
| 2017 | $4,575 | $380,246 | $133,086 | $247,160 |
| 2016 | $4,528 | $372,791 | $130,477 | $242,314 |
| 2015 | $4,500 | $367,192 | $128,517 | $238,675 |
| 2014 | $4,502 | $360,000 | $126,000 | $234,000 |
Source: Public Records
Map
Nearby Homes
- 3618 S Monitor Cir
- 3822 N Monitor Cir
- 3533 Harpers Ferry Dr
- 3845 Peninsula Ct
- 6290 Chesapeake Cir
- 3722 W Benjamin Holt Dr Unit 7
- 3722 W Benjamin Holt Dr Unit 16
- 3720 W Benjamin Holt Dr Unit 10
- 6520 Embarcadero Dr Unit 18
- 6412 Embarcadero Dr
- 6610 Embarcadero Dr Unit 7
- 3216 Polk Way
- 6395 Embarcadero Dr
- 6039 Carolina Cir
- 6669 Embarcadero Dr Unit 16
- 6669 Embarcadero Dr Unit 2
- 6713 Embarcadero Dr Unit 22
- 6713 Embarcadero Dr Unit 29
- 3115 Polk Way
- 3827 Fourteen Mile Dr
- 3646 N Monitor Cir
- 3638 N Monitor Cir
- 3708 N Monitor Cir Unit 5
- 3645 S Monitor Cir
- 3637 S Monitor Cir
- 3620 N Monitor Cir
- 3716 N Monitor Cir
- 3707 S Monitor Cir
- 3647 N Monitor Cir Unit NOR
- 3703 N Monitor Cir
- 3639 N Monitor Cir
- 3711 N Monitor Cir
- 3627 N Monitor Cir
- 3621 S Monitor Cir
- 3613 N Monitor Cir
- 3613 N Monitor Cir
- 3722 N Monitor Cir
- 3717 N Monitor Cir
- 3715 S Monitor Cir
- 3612 N Monitor Cir