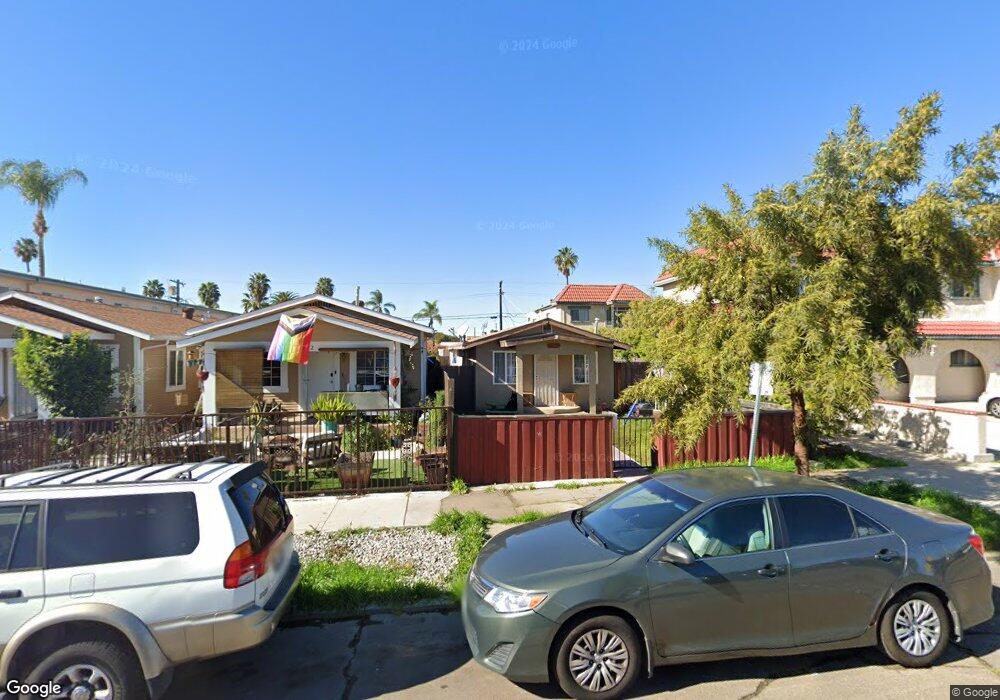
3648 42nd St San Diego, CA 92105
Castle NeighborhoodEstimated Value: $554,758 - $624,000
2
Beds
1
Bath
640
Sq Ft
$917/Sq Ft
Est. Value
About This Home
This home is located at 3648 42nd St, San Diego, CA 92105 and is currently estimated at $586,690, approximately $916 per square foot. 3648 42nd St is a home located in San Diego County with nearby schools including Cherokee Point Elementary School, Wilson Middle School, and Herbert Hoover High School.
Ownership History
Date
Name
Owned For
Owner Type
Purchase Details
Closed on
Dec 26, 2008
Sold by
Myc Limited Liability Company
Bought by
Myc Limited Liability Company
Current Estimated Value
Purchase Details
Closed on
Jul 14, 2008
Sold by
U S Bank Na
Bought by
Myc
Purchase Details
Closed on
Oct 17, 2007
Sold by
Pavon Martinez Rebeca
Bought by
Us Bank Na
Purchase Details
Closed on
Sep 13, 2005
Sold by
Pavon Mario
Bought by
Pavon Martinez Rebeca
Home Financials for this Owner
Home Financials are based on the most recent Mortgage that was taken out on this home.
Original Mortgage
$77,200
Interest Rate
5.32%
Mortgage Type
Stand Alone Second
Purchase Details
Closed on
Aug 15, 2005
Sold by
Us Financial Lp
Bought by
Pavon Martinez Rebeca
Home Financials for this Owner
Home Financials are based on the most recent Mortgage that was taken out on this home.
Original Mortgage
$77,200
Interest Rate
5.32%
Mortgage Type
Stand Alone Second
Purchase Details
Closed on
Mar 21, 2005
Sold by
Veizaga Rene and Veizaga Patricia Eugenia
Bought by
Us Financial Lp
Purchase Details
Closed on
Jan 18, 1985
Create a Home Valuation Report for This Property
The Home Valuation Report is an in-depth analysis detailing your home's value as well as a comparison with similar homes in the area
Home Values in the Area
Average Home Value in this Area
Purchase History
| Date | Buyer | Sale Price | Title Company |
|---|---|---|---|
| Myc Limited Liability Company | -- | Chicago Title Company | |
| Myc | $131,500 | Chicago Title Company | |
| Us Bank Na | $255,000 | Lsi | |
| Pavon Martinez Rebeca | -- | United Title Company | |
| Pavon Martinez Rebeca | $386,000 | United Title Company | |
| Us Financial Lp | $283,000 | Fidelity National Title | |
| -- | $28,500 | -- |
Source: Public Records
Mortgage History
| Date | Status | Borrower | Loan Amount |
|---|---|---|---|
| Previous Owner | Pavon Martinez Rebeca | $77,200 | |
| Previous Owner | Pavon Martinez Rebeca | $308,800 |
Source: Public Records
Tax History Compared to Growth
Tax History
| Year | Tax Paid | Tax Assessment Tax Assessment Total Assessment is a certain percentage of the fair market value that is determined by local assessors to be the total taxable value of land and additions on the property. | Land | Improvement |
|---|---|---|---|---|
| 2025 | $2,070 | $169,006 | $115,891 | $53,115 |
| 2024 | $2,070 | $165,693 | $113,619 | $52,074 |
| 2023 | $2,024 | $162,445 | $111,392 | $51,053 |
| 2022 | $1,970 | $159,260 | $109,208 | $50,052 |
| 2021 | $1,957 | $156,138 | $107,067 | $49,071 |
| 2020 | $1,933 | $154,538 | $105,970 | $48,568 |
| 2019 | $1,899 | $151,509 | $103,893 | $47,616 |
| 2018 | $1,777 | $148,539 | $101,856 | $46,683 |
| 2017 | $1,735 | $145,627 | $99,859 | $45,768 |
| 2016 | $1,706 | $142,772 | $97,901 | $44,871 |
| 2015 | $1,681 | $140,628 | $96,431 | $44,197 |
| 2014 | $1,504 | $125,000 | $86,000 | $39,000 |
Source: Public Records
Map
Nearby Homes
- 3450 42nd St
- 4600 Myrtle Ave
- 3815 42nd St
- 3833-39 N 42nd St
- 3825 Van Dyke Ave
- 3655 44th St
- 4128 Thorn St
- 0 42nd Unit PTP2505266
- 3571 Highland Ave
- 3565 Highland Ave Unit 5
- 4025 Van Dyke Ave
- 4055 Van Dyke Ave
- 3863 Highland Ave Unit 4
- 3578 Chamoune Ave
- 3733 Chamoune Ave
- 3846 38th St Unit 5
- 3846 38th St Unit 3
- 2931 Dahlia St Unit 12
- 4153 42nd St
- 4041 38th St
- 3642 42nd St
- 3640 42nd St
- 3654 42nd St
- 3632 42nd St
- 3662 42nd St
- 3626 42nd St
- 3666 42nd St Unit 68
- 3645 Marlborough Ave
- 3641 1/2 Marlborough Ave
- 3622 42nd St
- 3637 Marlborough Ave
- 3674 42nd St
- 3633 Marlborough Ave
- 3661 Marlborough Ave
- 3641 Marlborough Ave
- 3615 42nd St Unit 3615 42nd Street
- 3639 42nd St
- 3610 42nd St Unit 12
- 3680 42nd St
- 3627 42nd St Unit 33