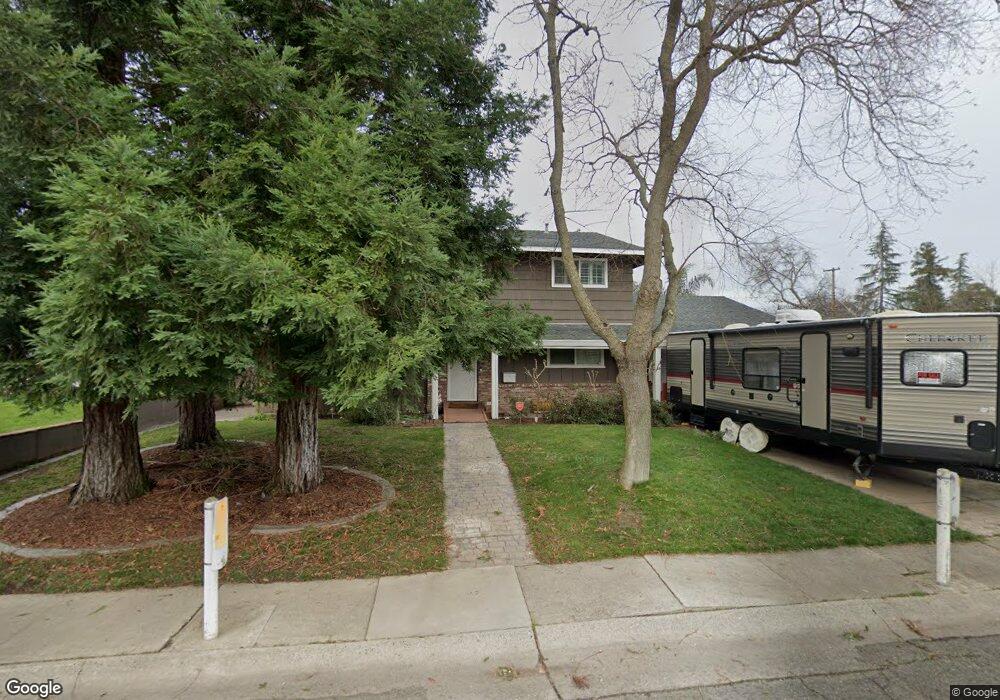
3649 Orangerie Way Carmichael, CA 95608
Estimated Value: $690,039 - $878,000
4
Beds
3
Baths
2,400
Sq Ft
$318/Sq Ft
Est. Value
About This Home
This home is located at 3649 Orangerie Way, Carmichael, CA 95608 and is currently estimated at $764,260, approximately $318 per square foot. 3649 Orangerie Way is a home located in Sacramento County with nearby schools including Carmichael Elementary School, John Barrett Middle School, and Del Campo High School.
Ownership History
Date
Name
Owned For
Owner Type
Purchase Details
Closed on
Nov 26, 2008
Sold by
Dines Gregory S and Dines Cynthia
Bought by
Dines Gregory Scott and Dines Cynthia Anne
Current Estimated Value
Purchase Details
Closed on
Oct 31, 2006
Sold by
Dines Gregory S and Dines Cynthia
Bought by
Dines Gregory S and Dines Cynthia
Home Financials for this Owner
Home Financials are based on the most recent Mortgage that was taken out on this home.
Original Mortgage
$417,000
Outstanding Balance
$248,733
Interest Rate
6.36%
Mortgage Type
New Conventional
Estimated Equity
$515,527
Purchase Details
Closed on
May 15, 2001
Sold by
Gandy Joan M
Bought by
Dines Gregory S and Brady Cynthia
Home Financials for this Owner
Home Financials are based on the most recent Mortgage that was taken out on this home.
Original Mortgage
$250,800
Interest Rate
7.03%
Create a Home Valuation Report for This Property
The Home Valuation Report is an in-depth analysis detailing your home's value as well as a comparison with similar homes in the area
Home Values in the Area
Average Home Value in this Area
Purchase History
| Date | Buyer | Sale Price | Title Company |
|---|---|---|---|
| Dines Gregory Scott | -- | None Available | |
| Dines Gregory S | -- | Liberty Title | |
| Dines Gregory S | $264,000 | Stewart Title |
Source: Public Records
Mortgage History
| Date | Status | Borrower | Loan Amount |
|---|---|---|---|
| Open | Dines Gregory S | $417,000 | |
| Closed | Dines Gregory S | $250,800 |
Source: Public Records
Tax History Compared to Growth
Tax History
| Year | Tax Paid | Tax Assessment Tax Assessment Total Assessment is a certain percentage of the fair market value that is determined by local assessors to be the total taxable value of land and additions on the property. | Land | Improvement |
|---|---|---|---|---|
| 2025 | $4,632 | $397,785 | $105,465 | $292,320 |
| 2024 | $4,632 | $389,987 | $103,398 | $286,589 |
| 2023 | $4,557 | $382,341 | $101,371 | $280,970 |
| 2022 | $4,464 | $374,845 | $99,384 | $275,461 |
| 2021 | $4,389 | $367,496 | $97,436 | $270,060 |
| 2020 | $4,306 | $363,728 | $96,437 | $267,291 |
| 2019 | $6,038 | $356,597 | $94,547 | $262,050 |
| 2018 | $4,163 | $349,606 | $92,694 | $256,912 |
| 2017 | $4,125 | $342,752 | $90,877 | $251,875 |
| 2016 | $3,851 | $336,033 | $89,096 | $246,937 |
| 2015 | $3,829 | $330,986 | $87,758 | $243,228 |
| 2014 | $3,749 | $324,503 | $86,039 | $238,464 |
Source: Public Records
Map
Nearby Homes
- 3517 Bajamont Way
- 6747 Steele Oak Ln
- 3417 Lindi Ct
- 3401 Riverdale Way
- 7121 Stella Ln Unit 25
- 7121 Stella Ln Unit 24
- 7131 Stella Ln Unit 32
- 4045 Grover Ct
- 6515 Grant Ave
- Plan 3 at The Paseos at Carmichael - The Paseos
- Plan 2 at The Paseos at Carmichael - The Paseos
- Plan 1 at The Paseos at Carmichael - The Paseos
- 4106 Porton Ln
- 8204 Caminata Ln
- 4088 Porton Ln
- 4068 Porton Ln
- 4072 Porton Ln
- 6996 Lincoln Creek Cir
- 4019 Porton Ln
- 4076 Porton Ln
- 3641 Orangerie Way
- 3701 Orangerie Way
- 3634 Ava Way
- 3633 Orangerie Way
- 3707 Orangerie Way
- 3648 Orangerie Way
- 6938 Sutter Ave
- 3640 Orangerie Way
- 3700 Orangerie Way
- 3625 Orangerie Way
- 3632 Orangerie Way
- 3715 Orangerie Way
- 3706 Orangerie Way
- 3640 Ava Way
- 3628 Ava Way
- 3712 Orangerie Way
- 3624 Orangerie Way
- 3621 Orangerie Way
- 3721 Orangerie Way
- 6942 Sutter Ave