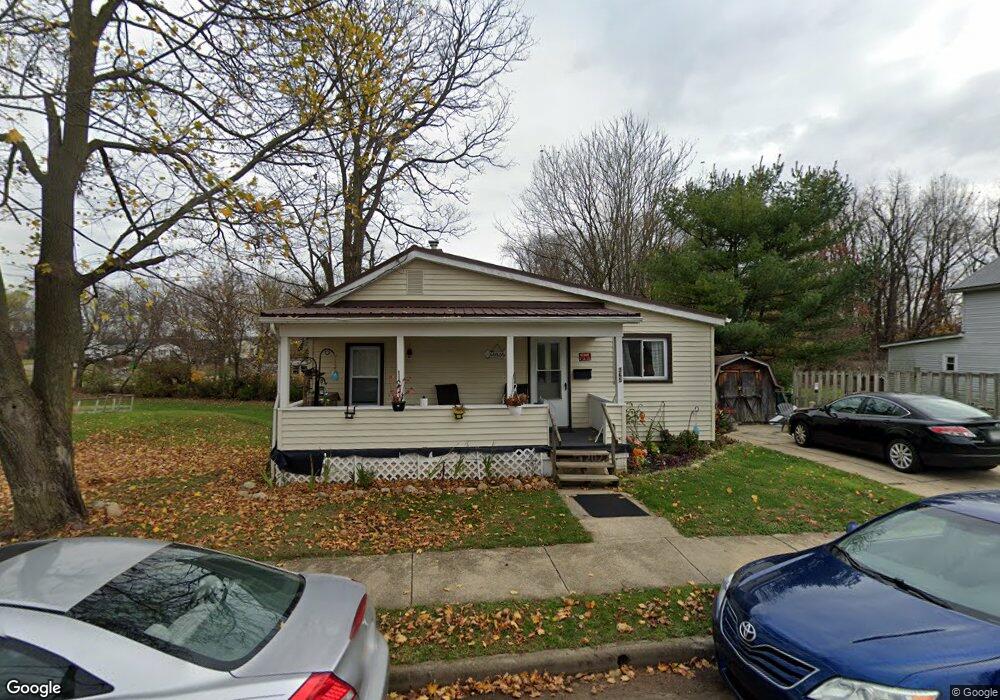
365 Bardon St Wooster, OH 44691
Estimated Value: $116,000 - $143,000
3
Beds
1
Bath
982
Sq Ft
$130/Sq Ft
Est. Value
About This Home
This home is located at 365 Bardon St, Wooster, OH 44691 and is currently estimated at $127,667, approximately $130 per square foot. 365 Bardon St is a home located in Wayne County with nearby schools including Cornerstone Elementary School, Edgewood Middle School, and Wooster High School.
Ownership History
Date
Name
Owned For
Owner Type
Purchase Details
Closed on
Sep 9, 2018
Sold by
Defibaugh Bret A and Defibaugh Deborah K
Bought by
Defibaugh Properties Llc
Current Estimated Value
Purchase Details
Closed on
Oct 27, 2000
Sold by
Flory Genn H
Bought by
Defibaugh Bret A and Defibaugh Deborah
Home Financials for this Owner
Home Financials are based on the most recent Mortgage that was taken out on this home.
Original Mortgage
$45,000
Interest Rate
9.75%
Mortgage Type
New Conventional
Purchase Details
Closed on
Dec 16, 1997
Sold by
Harmon Evelyn G
Bought by
Bullard Christine
Purchase Details
Closed on
Aug 28, 1996
Sold by
Ladrach Jerry J
Bought by
Harmon Evelyn G
Purchase Details
Closed on
Aug 31, 1989
Sold by
Molter Michael
Bought by
Ladrach Jerry J and Ladrach Mary J
Create a Home Valuation Report for This Property
The Home Valuation Report is an in-depth analysis detailing your home's value as well as a comparison with similar homes in the area
Home Values in the Area
Average Home Value in this Area
Purchase History
| Date | Buyer | Sale Price | Title Company |
|---|---|---|---|
| Defibaugh Properties Llc | -- | None Available | |
| Defibaugh Bret A | $47,500 | -- | |
| Bullard Christine | $38,000 | -- | |
| Harmon Evelyn G | $35,500 | -- | |
| Ladrach Jerry J | $23,000 | -- |
Source: Public Records
Mortgage History
| Date | Status | Borrower | Loan Amount |
|---|---|---|---|
| Closed | Defibaugh Bret A | $45,000 |
Source: Public Records
Tax History
| Year | Tax Paid | Tax Assessment Tax Assessment Total Assessment is a certain percentage of the fair market value that is determined by local assessors to be the total taxable value of land and additions on the property. | Land | Improvement |
|---|---|---|---|---|
| 2025 | $1,052 | $24,830 | $6,930 | $17,900 |
| 2024 | $1,052 | $24,830 | $6,930 | $17,900 |
| 2023 | $1,056 | $24,830 | $6,930 | $17,900 |
| 2022 | $1,007 | $18,810 | $5,250 | $13,560 |
| 2021 | $1,038 | $18,810 | $5,250 | $13,560 |
| 2020 | $986 | $18,810 | $5,250 | $13,560 |
| 2019 | $862 | $15,760 | $5,100 | $10,660 |
| 2018 | $865 | $15,760 | $5,100 | $10,660 |
| 2017 | $872 | $15,760 | $5,100 | $10,660 |
| 2016 | $900 | $15,160 | $4,900 | $10,260 |
| 2015 | $884 | $15,160 | $4,900 | $10,260 |
| 2014 | $884 | $15,160 | $4,900 | $10,260 |
| 2013 | $931 | $15,730 | $5,040 | $10,690 |
Source: Public Records
Map
Nearby Homes
- 513 Washington St
- 938 Washington St
- 4859 Prosperity Way
- 960 Washington St
- 2630 Bauman Dr
- 419 Nold Ave
- 331 Derr Ave
- 223 E Larwill St
- 534 N Buckeye St
- 423 N Market St
- 814 N Bever St
- 134 E Bowman St Unit 1/2
- 227 N Walnut St
- 1530 Willoughby Dr
- 140 Ohio St
- 1575 Bellevue Dr
- 219 Mulberry St
- 230 Clark Ave
- 1117 Quinby Ave
- 2632 Peach Ln
Your Personal Tour Guide
Ask me questions while you tour the home.