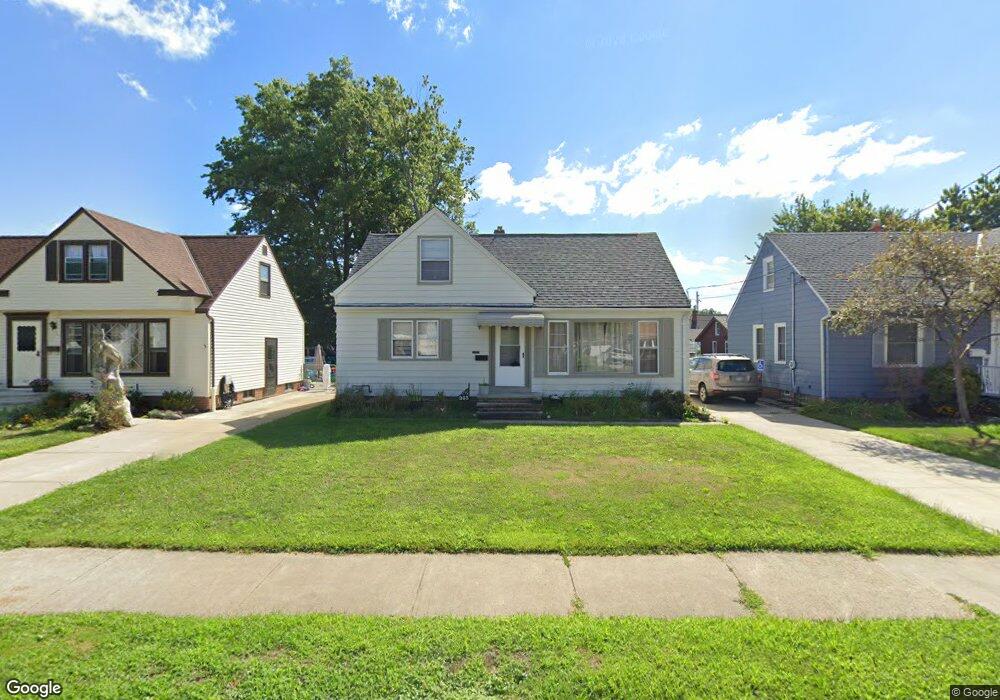
365 Clarmont Rd Willowick, OH 44095
Estimated Value: $161,000 - $184,000
3
Beds
1
Bath
994
Sq Ft
$178/Sq Ft
Est. Value
About This Home
This home is located at 365 Clarmont Rd, Willowick, OH 44095 and is currently estimated at $176,906, approximately $177 per square foot. 365 Clarmont Rd is a home located in Lake County with nearby schools including Royalview Elementary School, Willowick Middle School, and North High School.
Ownership History
Date
Name
Owned For
Owner Type
Purchase Details
Closed on
Dec 30, 2015
Sold by
Cocca Pasquale S
Bought by
Cocca Pasquale S
Current Estimated Value
Purchase Details
Closed on
Oct 5, 2009
Sold by
Homesales Inc
Bought by
Cocca Pasquale
Purchase Details
Closed on
Aug 24, 2009
Sold by
Nordstrom Brian D
Bought by
Homesales Inc
Purchase Details
Closed on
Aug 16, 2006
Sold by
Nordstrom Gerald A and Nordstrom Judith
Bought by
Nordstrom Brian D
Purchase Details
Closed on
Aug 12, 2006
Sold by
Nordstrom Cathleen A
Bought by
Nordstrom Brian D
Purchase Details
Closed on
Aug 10, 2006
Sold by
Hudimac Elaine R and Hudimac Edward
Bought by
Nordstrom Brian D
Purchase Details
Closed on
Jun 27, 2003
Sold by
Estate Of Frank A Nordstrom Jr
Bought by
Nordstrom Cathleen A
Purchase Details
Closed on
Jan 1, 1990
Bought by
Nordstrom La Verne
Create a Home Valuation Report for This Property
The Home Valuation Report is an in-depth analysis detailing your home's value as well as a comparison with similar homes in the area
Home Values in the Area
Average Home Value in this Area
Purchase History
| Date | Buyer | Sale Price | Title Company |
|---|---|---|---|
| Cocca Pasquale S | -- | None Available | |
| Cocca Pasquale | $75,000 | Attorney | |
| Homesales Inc | $78,000 | None Available | |
| Nordstrom Brian D | $20,000 | Us Title Agency Inc | |
| Nordstrom Brian D | $20,000 | Us Title Agency Inc | |
| Nordstrom Brian D | $20,000 | None Available | |
| Nordstrom Cathleen A | -- | -- | |
| Nordstrom La Verne | -- | -- |
Source: Public Records
Tax History
| Year | Tax Paid | Tax Assessment Tax Assessment Total Assessment is a certain percentage of the fair market value that is determined by local assessors to be the total taxable value of land and additions on the property. | Land | Improvement |
|---|---|---|---|---|
| 2025 | -- | $53,860 | $15,150 | $38,710 |
| 2024 | -- | $53,860 | $15,150 | $38,710 |
| 2023 | $3,968 | $38,300 | $12,380 | $25,920 |
| 2022 | $2,770 | $38,300 | $12,380 | $25,920 |
| 2021 | $2,781 | $38,300 | $12,380 | $25,920 |
| 2020 | $2,596 | $32,450 | $10,490 | $21,960 |
| 2019 | $2,433 | $32,450 | $10,490 | $21,960 |
| 2018 | $2,513 | $32,930 | $14,960 | $17,970 |
| 2017 | $2,621 | $32,930 | $14,960 | $17,970 |
| 2016 | $2,616 | $32,930 | $14,960 | $17,970 |
| 2015 | $2,562 | $32,930 | $14,960 | $17,970 |
| 2014 | $2,452 | $32,930 | $14,960 | $17,970 |
| 2013 | $2,453 | $32,930 | $14,960 | $17,970 |
Source: Public Records
Map
Nearby Homes
- 30008 Mildred Dr
- 30102 Mildred Dr
- 518 E 305th St
- 459 Cole Plaza
- 30325 Mildred Dr
- 30408 Mildred Dr
- 29070 W Willowick Dr
- 311 E 293rd St
- 346 Lakewick Ln
- 294 Lakewick Ln
- 300 Lakewick Ln
- 596 Terrace Plaza
- 29520 Bruce Dr
- 30002 Barjode Rd
- 30116 Barjode Rd
- 137 Larimar Dr
- 29613 Sylvan Dr
- 28759 Forest Rd
- 375 Beechwood Dr
- 701 E 315th St
- 367 Clarmont Rd
- 363 Clarmont Rd
- 369 Clarmont Rd
- 512 E 300th St
- 518 E 300th St
- 359 Clarmont Rd
- 371 Clarmont Rd
- 508 E 300th St
- 524 E 300th St
- 504 E 300th St
- 530 E 300th St
- 366 Clarmont Rd
- 373 Clarmont Rd
- 368 Clarmont Rd
- 364 Clarmont Rd
- 500 E 300th St
- 370 Clarmont Rd
- 362 Clarmont Rd
- 536 E 300th St
- 496 E 300th St
Your Personal Tour Guide
Ask me questions while you tour the home.