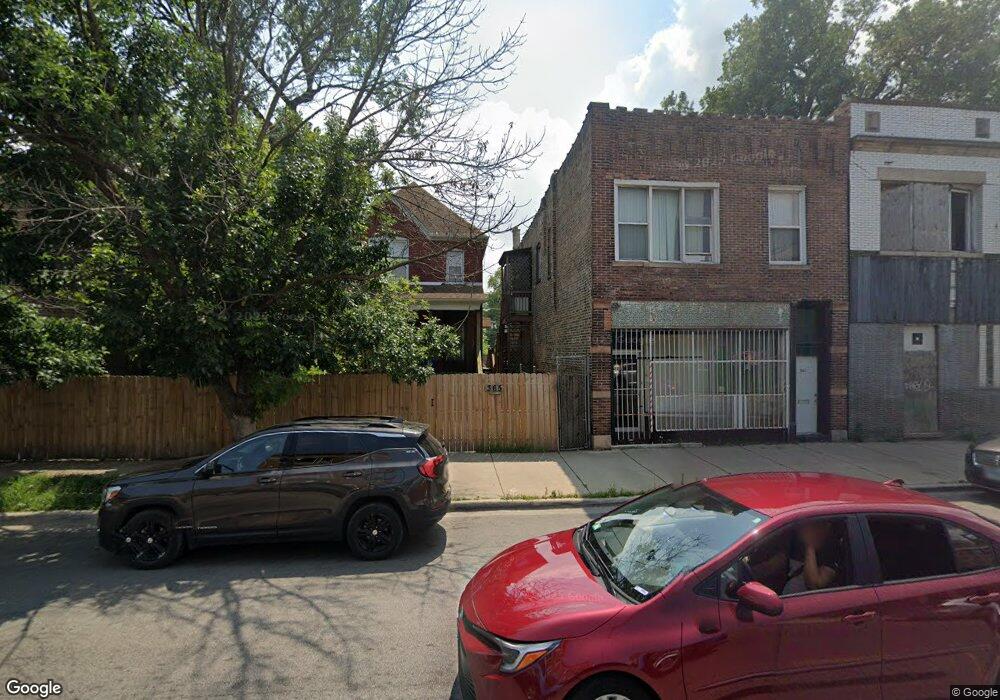
365 E 69th St Chicago, IL 60637
Park Manor NeighborhoodEstimated Value: $156,000 - $251,000
3
Beds
1
Bath
1,618
Sq Ft
$119/Sq Ft
Est. Value
About This Home
This home is located at 365 E 69th St, Chicago, IL 60637 and is currently estimated at $193,242, approximately $119 per square foot. 365 E 69th St is a home located in Cook County with nearby schools including Park Manor Elementary School, Augustus Tolton Catholic Academy, and Chicago Sda Elementary School.
Ownership History
Date
Name
Owned For
Owner Type
Purchase Details
Closed on
Sep 26, 2018
Sold by
Southsouth Llc Series 365 67E69thstreet
Bought by
Oyibo Charles
Current Estimated Value
Purchase Details
Closed on
Nov 2, 2009
Sold by
Deutsche Bank National Trust Company
Bought by
Oyibo Charles E
Purchase Details
Closed on
Nov 9, 2007
Sold by
Johnson
Bought by
Deutsche Bank National Trust Co and Argent Mortgage Securities Inc Asset Bac
Purchase Details
Closed on
May 18, 2004
Sold by
River Group Inc
Bought by
Johnson Willie
Home Financials for this Owner
Home Financials are based on the most recent Mortgage that was taken out on this home.
Original Mortgage
$106,250
Interest Rate
9.2%
Mortgage Type
Unknown
Purchase Details
Closed on
Feb 10, 2004
Sold by
Manufacturers & Traders Trust Co
Bought by
River Group Inc
Purchase Details
Closed on
Sep 13, 1994
Sold by
Howard Reynolds
Bought by
Howard Gregory C and Howard Madelyn
Create a Home Valuation Report for This Property
The Home Valuation Report is an in-depth analysis detailing your home's value as well as a comparison with similar homes in the area
Home Values in the Area
Average Home Value in this Area
Purchase History
| Date | Buyer | Sale Price | Title Company |
|---|---|---|---|
| Oyibo Charles | -- | Attorney | |
| Oyibo Charles E | $20,000 | 1St American Title | |
| Deutsche Bank National Trust Co | -- | None Available | |
| Johnson Willie | $125,000 | The Guarantee Title & Tr Co | |
| River Group Inc | $64,000 | First American Title | |
| Manufacturers & Traders Trust Co | -- | First American Title | |
| Howard Gregory C | -- | -- |
Source: Public Records
Mortgage History
| Date | Status | Borrower | Loan Amount |
|---|---|---|---|
| Previous Owner | Johnson Willie | $106,250 |
Source: Public Records
Tax History
| Year | Tax Paid | Tax Assessment Tax Assessment Total Assessment is a certain percentage of the fair market value that is determined by local assessors to be the total taxable value of land and additions on the property. | Land | Improvement |
|---|---|---|---|---|
| 2025 | $1,160 | $11,418 | $3,813 | $7,605 |
| 2024 | $1,160 | $11,418 | $3,813 | $7,605 |
| 2023 | $1,131 | $5,501 | $3,813 | $1,688 |
| 2022 | $1,131 | $5,501 | $3,813 | $1,688 |
| 2021 | $1,106 | $5,499 | $3,812 | $1,687 |
| 2020 | $3,176 | $14,256 | $3,812 | $10,444 |
| 2019 | $3,183 | $15,841 | $3,812 | $12,029 |
| 2018 | $3,129 | $15,841 | $3,812 | $12,029 |
| 2017 | $2,551 | $11,850 | $3,355 | $8,495 |
| 2016 | $2,373 | $11,850 | $3,355 | $8,495 |
| 2015 | $812 | $4,430 | $3,355 | $1,075 |
| 2014 | $647 | $3,489 | $2,745 | $744 |
| 2013 | $1,853 | $10,188 | $2,745 | $7,443 |
Source: Public Records
Map
Nearby Homes
- 6835 S Calumet Ave
- 6858 S Calumet Ave
- 6826 S King Dr Unit KIN
- 6848 S Anthony Ave
- 6932 S Calumet Ave
- 6926 S Vernon Ave
- 6959 S Calumet Ave
- 6948 S Eberhart Ave
- 6954 S Prairie Ave
- 6847 S Indiana Ave
- 7027 S Calumet Ave
- 6961 S Eberhart Ave
- 7038 S King Dr Unit KIN
- 6953 S Indiana Ave
- 6906 S Indiana Ave
- 7033 S Vernon Ave
- 6840 S Indiana Ave
- 7042 S Vernon Ave
- 6741 S Eberhart Ave
- 201 E 70th St
- 365 E 69th St
- 359 E 69th St
- 361 E 69th St
- 369 E 69th St
- 6910 S Dr Martin Luther King Dr
- 366 E 69th St
- 6909 S Calumet Ave
- 6913 S Calumet Ave
- 6913 S Calumet Ave
- 6917 S Calumet Ave
- 370 E 69th St
- 6920 S King Dr Unit KIN
- 6918 S Dr Martin Luther Dr
- 6919 S Calumet Ave
- 372 E 69th St
- 372 E 69th St Unit 1
- 372 E 69th St Unit 1-2
- 374 E 69th St
- 374 E 69th St Unit A
- 6858 S King Dr
Your Personal Tour Guide
Ask me questions while you tour the home.