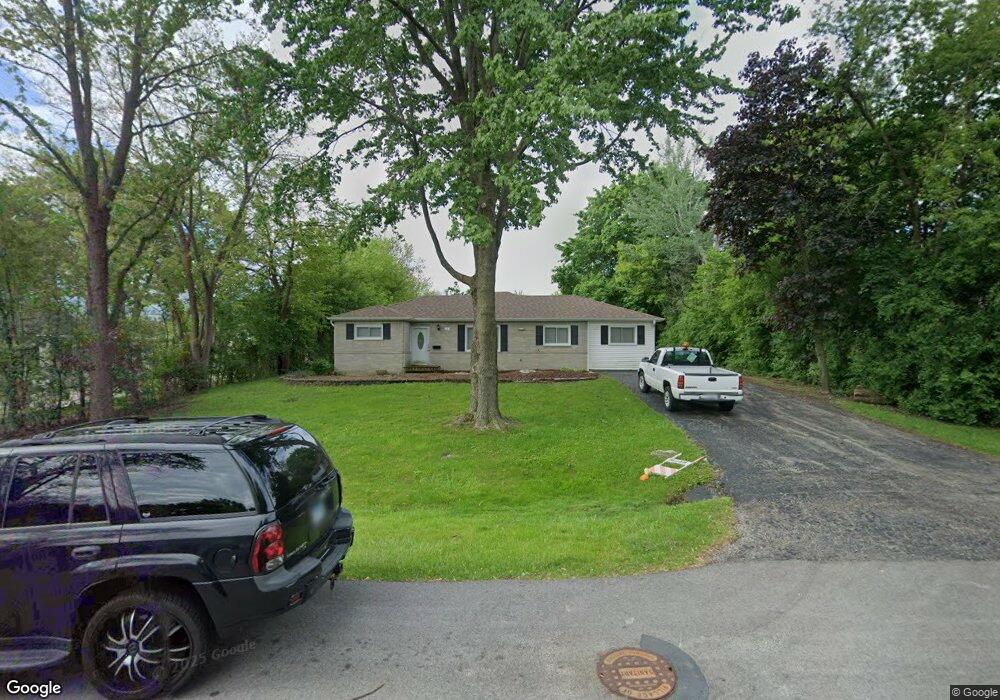
365 Hawthorn Ln Hoffman Estates, IL 60169
Woodfield NeighborhoodEstimated Value: $374,000 - $422,000
3
Beds
2
Baths
1,436
Sq Ft
$274/Sq Ft
Est. Value
About This Home
This home is located at 365 Hawthorn Ln, Hoffman Estates, IL 60169 and is currently estimated at $393,123, approximately $273 per square foot. 365 Hawthorn Ln is a home located in Cook County with nearby schools including Fairview Elementary School, Helen Keller Junior High School, and J B Conant High School.
Ownership History
Date
Name
Owned For
Owner Type
Purchase Details
Closed on
Mar 12, 2021
Sold by
Pineda Castillo Gustavo and Pineda Maria
Bought by
Pineda Castillo Gustavo and Pineda Maria
Current Estimated Value
Purchase Details
Closed on
Sep 28, 2017
Sold by
Gallo Thomas M and Mullin Daniel P
Bought by
Lopez Castillo Gustavo Pineda and Lopez Michaca Miguel Angel
Home Financials for this Owner
Home Financials are based on the most recent Mortgage that was taken out on this home.
Original Mortgage
$184,000
Outstanding Balance
$155,430
Interest Rate
4.25%
Mortgage Type
New Conventional
Estimated Equity
$237,693
Purchase Details
Closed on
Feb 14, 2006
Sold by
Forti Nicholas P
Bought by
Gallo Thomas M and Mullin Daniel P
Home Financials for this Owner
Home Financials are based on the most recent Mortgage that was taken out on this home.
Original Mortgage
$218,548
Interest Rate
6.37%
Mortgage Type
Unknown
Create a Home Valuation Report for This Property
The Home Valuation Report is an in-depth analysis detailing your home's value as well as a comparison with similar homes in the area
Home Values in the Area
Average Home Value in this Area
Purchase History
| Date | Buyer | Sale Price | Title Company |
|---|---|---|---|
| Pineda Castillo Gustavo | -- | Chicago Title Insurance Co | |
| Lopez Castillo Gustavo Pineda | $230,000 | Attorneys Title Guaranty Fun | |
| Gallo Thomas M | $273,500 | First American Title Ins Co |
Source: Public Records
Mortgage History
| Date | Status | Borrower | Loan Amount |
|---|---|---|---|
| Open | Lopez Castillo Gustavo Pineda | $184,000 | |
| Previous Owner | Gallo Thomas M | $218,548 |
Source: Public Records
Tax History Compared to Growth
Tax History
| Year | Tax Paid | Tax Assessment Tax Assessment Total Assessment is a certain percentage of the fair market value that is determined by local assessors to be the total taxable value of land and additions on the property. | Land | Improvement |
|---|---|---|---|---|
| 2024 | $7,575 | $28,000 | $9,680 | $18,320 |
| 2023 | $7,300 | $28,000 | $9,680 | $18,320 |
| 2022 | $7,300 | $28,000 | $9,680 | $18,320 |
| 2021 | $5,728 | $20,426 | $10,285 | $10,141 |
| 2020 | $5,668 | $20,426 | $10,285 | $10,141 |
| 2019 | $5,715 | $22,951 | $10,285 | $12,666 |
| 2018 | $6,967 | $21,367 | $9,075 | $12,292 |
| 2017 | $7,213 | $22,521 | $9,075 | $13,446 |
| 2016 | $6,710 | $22,521 | $9,075 | $13,446 |
| 2015 | $6,264 | $19,502 | $7,865 | $11,637 |
| 2014 | $6,153 | $19,502 | $7,865 | $11,637 |
| 2013 | $5,996 | $19,502 | $7,865 | $11,637 |
Source: Public Records
Map
Nearby Homes
- 705 Ash Rd
- 465 Apache Ln
- 760 Buckeye Dr
- 1180 Apple St
- 845 Dracut Ln
- 1190 Apple St
- 700 Cumberland St
- 800 Linden Cir
- 100 Des Plaines Ln
- 325 Bayview Point Unit 56B
- 751 Edgelake Point Unit 68C
- 989 Butter Creek Ct Unit 3NE
- 365 Juniper Tree Ct
- 363 Oaktree Ct
- 601 Hanover Ct Unit Z2
- 370 Flagstaff Ln
- 147 Fulbright Ln
- 153 Fulbright Ln
- 313 Lincoln St
- 121 Chatsworth Cir
- 385 Hawthorn Ln
- 345 Hawthorn Ln
- 405 Hawthorn Ln
- 325 Hawthorn Ln
- 380 Hawthorn Ln
- 360 Hawthorn Ln
- 340 Hawthorn Ln
- 400 Hawthorn Ln
- 305 Hawthorn Ln
- 425 Hawthorn Ln
- 905 Ash Rd
- 420 Hawthorn Ln
- 2709 Hawthorn Ln
- 445 Hawthorn Ln
- 925 Ash Rd
- 440 Hawthorn Ln
- 405 E Bluebonnet Ln
- 295 Hawthorn Ln
- 945 Ash Rd
- 350 Alpine Ln