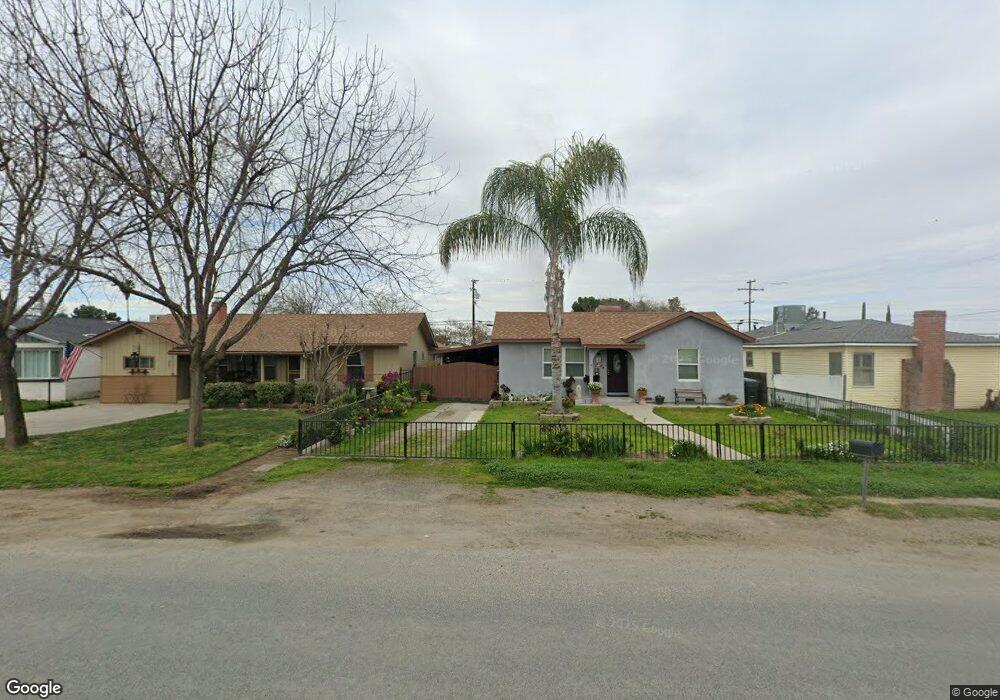
365 N Evans Rd Tipton, CA 93272
Estimated Value: $159,408 - $309,000
--
Bed
--
Bath
1,100
Sq Ft
$209/Sq Ft
Est. Value
About This Home
This home is located at 365 N Evans Rd, Tipton, CA 93272 and is currently estimated at $230,102, approximately $209 per square foot. 365 N Evans Rd is a home located in Tulare County with nearby schools including Tipton Elementary School, Palo Verde Elementary School, and Mission Oak High School.
Ownership History
Date
Name
Owned For
Owner Type
Purchase Details
Closed on
Jan 25, 2007
Sold by
Solis Albert G
Bought by
Solis Albert G and Solis Lucia
Current Estimated Value
Home Financials for this Owner
Home Financials are based on the most recent Mortgage that was taken out on this home.
Original Mortgage
$135,000
Interest Rate
8.12%
Mortgage Type
Stand Alone Refi Refinance Of Original Loan
Purchase Details
Closed on
May 23, 2006
Sold by
Solis Albert G
Bought by
Solis Albert G and Solis Lucia
Purchase Details
Closed on
Feb 14, 2006
Sold by
Solis Albert G
Bought by
Solis Albert G and Solis Lucia
Home Financials for this Owner
Home Financials are based on the most recent Mortgage that was taken out on this home.
Original Mortgage
$85,000
Interest Rate
6.15%
Mortgage Type
Stand Alone Refi Refinance Of Original Loan
Create a Home Valuation Report for This Property
The Home Valuation Report is an in-depth analysis detailing your home's value as well as a comparison with similar homes in the area
Home Values in the Area
Average Home Value in this Area
Purchase History
| Date | Buyer | Sale Price | Title Company |
|---|---|---|---|
| Solis Albert G | -- | Accommodation | |
| Solis Albert G | -- | Southland Title Of San Diego | |
| Solis Albert G | -- | Accommodation | |
| Solis Albert G | -- | Southland Title Of San Diego |
Source: Public Records
Mortgage History
| Date | Status | Borrower | Loan Amount |
|---|---|---|---|
| Closed | Solis Albert G | $135,000 | |
| Closed | Solis Albert G | $85,000 |
Source: Public Records
Tax History Compared to Growth
Tax History
| Year | Tax Paid | Tax Assessment Tax Assessment Total Assessment is a certain percentage of the fair market value that is determined by local assessors to be the total taxable value of land and additions on the property. | Land | Improvement |
|---|---|---|---|---|
| 2025 | $458 | $41,170 | $3,666 | $37,504 |
| 2024 | $458 | $40,364 | $3,595 | $36,769 |
| 2023 | $446 | $39,574 | $3,525 | $36,049 |
| 2022 | $433 | $38,799 | $3,456 | $35,343 |
| 2021 | $426 | $38,038 | $3,388 | $34,650 |
| 2020 | $437 | $37,648 | $3,353 | $34,295 |
| 2019 | $447 | $36,910 | $3,287 | $33,623 |
| 2018 | $440 | $36,187 | $3,223 | $32,964 |
| 2017 | $435 | $35,478 | $3,160 | $32,318 |
| 2016 | $417 | $34,782 | $3,098 | $31,684 |
| 2015 | $393 | $34,259 | $3,051 | $31,208 |
| 2014 | $393 | $33,588 | $2,991 | $30,597 |
Source: Public Records
Map
Nearby Homes
- 387 S Evans Rd
- 190 S Evans Rd
- 129 S Evans Rd
- 0 Klindera Ave
- 0 Avenue 144 Unit 231197
- 0 Avenue 144 Unit 230351
- 251 N Graham Rd
- 672 N Smith Rd
- 0 Ca-99 Unit 237484
- 0 Ca-99 Unit 202500357
- 10 Avenue 120
- 0 120 Ave Unit FR25132228
- 821 E Stanford Ave
- 10351 Avenue 112
- 2835 N School St
- 3184 Road 122
- 7599 Avenue 152
- 1430 N Park Dr
- 0 Road 120
- 99999 N Elm St
- 375 N Evans Rd
- 355 S Evans Rd
- 393 S Evans Rd
- 242 E Lerda Ave
- 374 S Evans Rd
- 362 S Evans Rd
- 354 S Evans Rd
- 382 S Evans Rd
- 386 S Evans Rd
- 345 S Evans Rd
- 394 S Evans Rd
- 344 S Evans Rd
- 398 S Evans Rd
- 321 W Jayne
- 376 N Thompson Rd
- 348 S Thompson Rd
- 336 S Thompson Rd
- 372 S Thompson Rd
- 340 S Thompson Rd
- 366 W Jayne