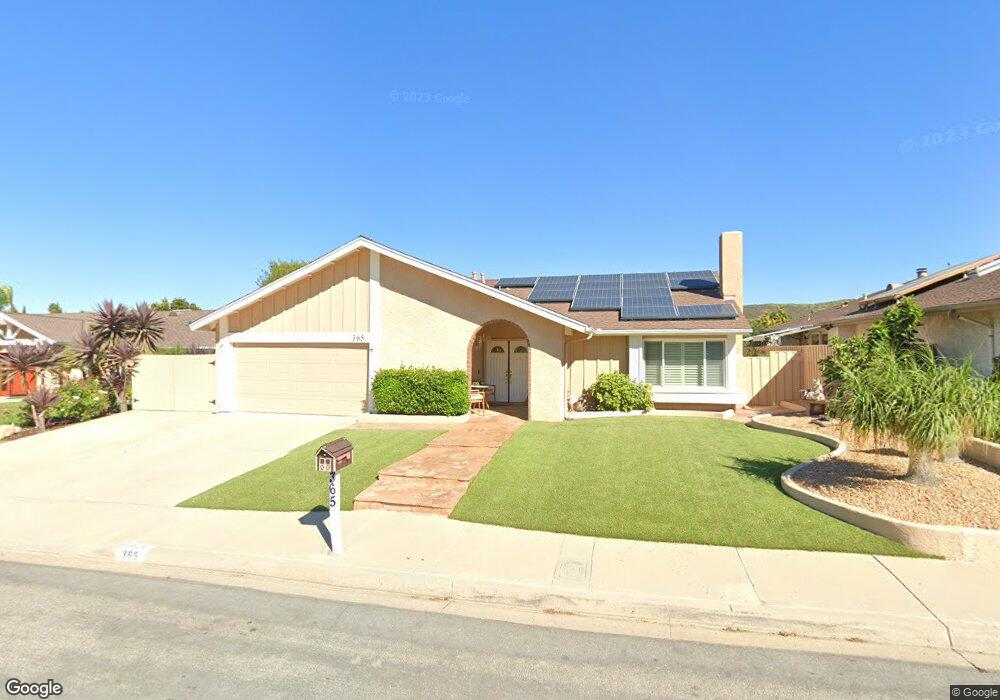
365 Pepperwood Ct Thousand Oaks, CA 91360
Estimated Value: $935,050 - $1,095,000
4
Beds
2
Baths
1,859
Sq Ft
$545/Sq Ft
Est. Value
About This Home
This home is located at 365 Pepperwood Ct, Thousand Oaks, CA 91360 and is currently estimated at $1,012,763, approximately $544 per square foot. 365 Pepperwood Ct is a home located in Ventura County with nearby schools including Weathersfield Elementary School, Los Cerritos Middle School, and Thousand Oaks High School.
Ownership History
Date
Name
Owned For
Owner Type
Purchase Details
Closed on
Nov 20, 2021
Sold by
Clelland Linda and Clelland Daniel H
Bought by
Clelland Linda and Clelland Trust
Current Estimated Value
Home Financials for this Owner
Home Financials are based on the most recent Mortgage that was taken out on this home.
Original Mortgage
$190,000
Outstanding Balance
$172,886
Interest Rate
2.5%
Mortgage Type
New Conventional
Estimated Equity
$839,877
Purchase Details
Closed on
Oct 23, 2014
Sold by
Clelland Linda
Bought by
Clelland Linda
Home Financials for this Owner
Home Financials are based on the most recent Mortgage that was taken out on this home.
Original Mortgage
$163,000
Interest Rate
3.5%
Mortgage Type
Adjustable Rate Mortgage/ARM
Purchase Details
Closed on
Dec 13, 1993
Sold by
Clelland Daniel H and Clelland Linda
Bought by
Clelland Daniel H and Clelland Linda
Create a Home Valuation Report for This Property
The Home Valuation Report is an in-depth analysis detailing your home's value as well as a comparison with similar homes in the area
Home Values in the Area
Average Home Value in this Area
Purchase History
| Date | Buyer | Sale Price | Title Company |
|---|---|---|---|
| Clelland Linda | -- | Wfg National Title Co Of Ca | |
| Clelland Linda | -- | Fidelity National Title Co | |
| Clelland Daniel H | -- | -- |
Source: Public Records
Mortgage History
| Date | Status | Borrower | Loan Amount |
|---|---|---|---|
| Open | Clelland Linda | $190,000 | |
| Closed | Clelland Linda | $163,000 |
Source: Public Records
Tax History Compared to Growth
Tax History
| Year | Tax Paid | Tax Assessment Tax Assessment Total Assessment is a certain percentage of the fair market value that is determined by local assessors to be the total taxable value of land and additions on the property. | Land | Improvement |
|---|---|---|---|---|
| 2025 | $2,420 | $166,139 | $46,773 | $119,366 |
| 2024 | $2,420 | $162,882 | $45,856 | $117,026 |
| 2023 | $2,326 | $159,689 | $44,957 | $114,732 |
| 2022 | $2,272 | $156,558 | $44,075 | $112,483 |
| 2021 | $2,216 | $153,489 | $43,211 | $110,278 |
| 2020 | $1,828 | $151,918 | $42,769 | $109,149 |
| 2019 | $1,779 | $148,940 | $41,931 | $107,009 |
| 2018 | $1,733 | $146,020 | $41,109 | $104,911 |
| 2017 | $1,696 | $143,157 | $40,303 | $102,854 |
| 2016 | $1,675 | $140,351 | $39,513 | $100,838 |
| 2015 | $1,648 | $138,244 | $38,920 | $99,324 |
| 2014 | $1,610 | $135,537 | $38,158 | $97,379 |
Source: Public Records
Map
Nearby Homes
- 416 Camino Dos Palos
- 87 Mcafee Ct
- 73 Mcafee Ct
- 71 Del Ray Cir
- 221 Mcafee Ct
- 2947 Camino Del Zuro
- 761 Flying Hills Ln
- 3097 Camino Del Zuro
- 2669 Calle Bienvenido
- 921 Calle Pinata
- 2651 Sirius St
- 731 Calle Nogal
- 2797 Beckett Ct
- 1134 Calle Pinata
- 650 Calle Pensamiento
- 970 Calle Nogal
- 3011 Marigold Place
- 2965 Dogwood Cir
- 2340 Aldrich Cir
- 1450 Corte de Primavera
- 381 Pepperwood Ct
- 349 Pepperwood Ct
- 3266 Cherrywood Dr
- 3282 Cherrywood Dr
- 366 Pepperwood Ct
- 333 Pepperwood Ct
- 382 Pepperwood Ct
- 397 Pepperwood Ct
- 350 Pepperwood Ct
- 3258 Cherrywood Dr
- 3290 Cherrywood Dr
- 334 Pepperwood Ct
- 411 Pepperwood Ct
- 398 Pepperwood Ct
- 317 Pepperwood Ct
- 414 Pepperwood Ct
- 3272 Valewood Cir
- 3298 Cherrywood Dr
- 3251 Winter Brook Ct
- 3259 Winter Brook Ct