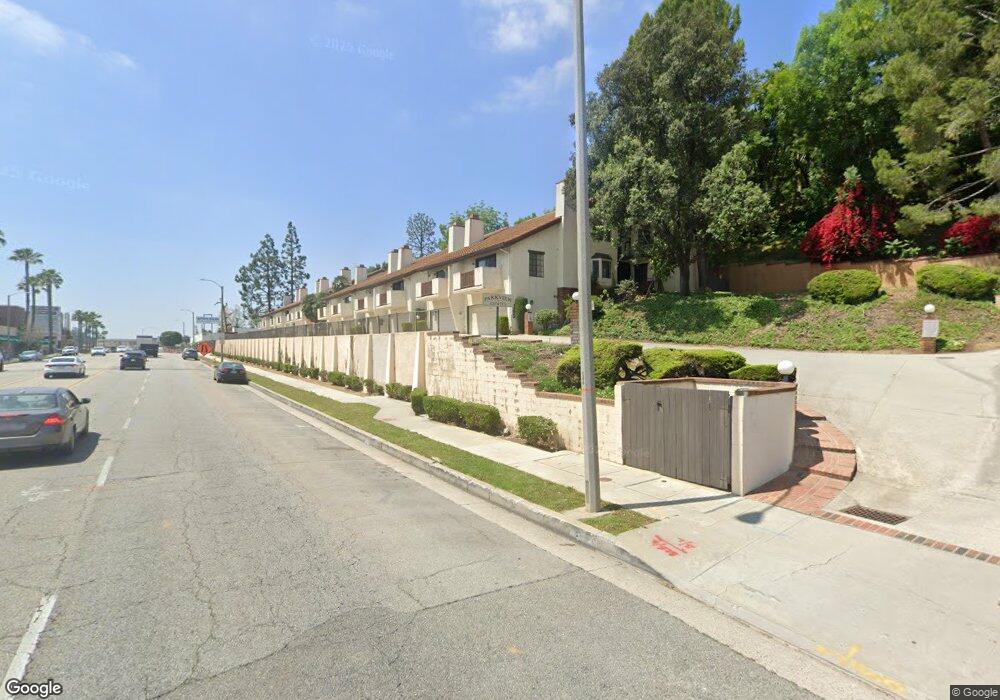
365 S Atlantic Blvd Unit C Monterey Park, CA 91754
Estimated Value: $653,000 - $970,000
4
Beds
3
Baths
1,601
Sq Ft
$501/Sq Ft
Est. Value
About This Home
This home is located at 365 S Atlantic Blvd Unit C, Monterey Park, CA 91754 and is currently estimated at $802,444, approximately $501 per square foot. 365 S Atlantic Blvd Unit C is a home located in Los Angeles County with nearby schools including Monterey Highlands Elementary School, Mark Keppel High School, and St. Stephen Martyr School.
Ownership History
Date
Name
Owned For
Owner Type
Purchase Details
Closed on
Nov 13, 2003
Sold by
Lee Elena Kit Ying and Lee Jackarline Kit Man
Bought by
Lee Elena Kit Ying
Current Estimated Value
Home Financials for this Owner
Home Financials are based on the most recent Mortgage that was taken out on this home.
Original Mortgage
$150,000
Interest Rate
5.89%
Mortgage Type
Purchase Money Mortgage
Purchase Details
Closed on
Jul 26, 1996
Sold by
Lee Jackarline Kit Man
Bought by
Lee Jackarline Kit Man
Purchase Details
Closed on
Apr 12, 1996
Sold by
Quach Danny
Bought by
Lee Elena Kit Ying
Home Financials for this Owner
Home Financials are based on the most recent Mortgage that was taken out on this home.
Original Mortgage
$121,600
Interest Rate
7.8%
Create a Home Valuation Report for This Property
The Home Valuation Report is an in-depth analysis detailing your home's value as well as a comparison with similar homes in the area
Home Values in the Area
Average Home Value in this Area
Purchase History
| Date | Buyer | Sale Price | Title Company |
|---|---|---|---|
| Lee Elena Kit Ying | -- | Fidelity National Title Co | |
| Lee Jackarline Kit Man | -- | -- | |
| Lee Elena Kit Ying | -- | California Counties Title Co | |
| Man Elena Kit | $152,000 | California Counties Title Co |
Source: Public Records
Mortgage History
| Date | Status | Borrower | Loan Amount |
|---|---|---|---|
| Closed | Lee Elena Kit Ying | $150,000 | |
| Closed | Man Elena Kit | $121,600 |
Source: Public Records
Tax History Compared to Growth
Tax History
| Year | Tax Paid | Tax Assessment Tax Assessment Total Assessment is a certain percentage of the fair market value that is determined by local assessors to be the total taxable value of land and additions on the property. | Land | Improvement |
|---|---|---|---|---|
| 2025 | $3,412 | $252,485 | $50,488 | $201,997 |
| 2024 | $3,412 | $247,536 | $49,499 | $198,037 |
| 2023 | $3,342 | $242,683 | $48,529 | $194,154 |
| 2022 | $3,187 | $237,926 | $47,578 | $190,348 |
| 2021 | $3,141 | $233,262 | $46,646 | $186,616 |
| 2019 | $3,030 | $226,345 | $45,263 | $181,082 |
| 2018 | $3,013 | $221,908 | $44,376 | $177,532 |
| 2016 | $2,791 | $213,292 | $42,653 | $170,639 |
| 2015 | $2,746 | $210,089 | $42,013 | $168,076 |
| 2014 | $2,713 | $205,975 | $41,191 | $164,784 |
Source: Public Records
Map
Nearby Homes
- 408 De la Fuente St
- 311 Montechico Dr
- 419 S Chandler Ave Unit 521
- 0 Garvey Ave Unit MB21123625
- 1141 Williams St
- 651 Villa Monte Ave
- 259 Fremont Ave
- 2409 Siwanoy Dr
- 218 N Mc Pherrin Ave
- 419 N Chandler Ave Unit 508
- 419 N Chandler Ave Unit 311
- 419 N Chandler Ave Unit 308
- 419 N Chandler Ave Unit 413
- 419 N Chandler Ave Unit 305
- 419 N Chandler Ave Unit 319
- 801 S Bradshawe Ave
- 421 S Garfield Ave Unit 79
- 513 N Chandler Ave Unit E
- 500 N Moore Ave Unit E
- 824 De la Fuente St
- 365 S Atlantic Blvd
- 365 S Atlantic Blvd Unit A
- 365 S Atlantic Blvd Unit B
- 365 S Atlantic Blvd Unit D
- 365 S Atlantic Blvd Unit E
- 365 S Atlantic Blvd Unit F
- 336 De la Fuente St
- 330 De la Fuente St
- 340 De la Fuente St
- 385 S Atlantic Blvd
- 385 S Atlantic Blvd Unit E
- 385 S Atlantic Blvd Unit F
- 385 S Atlantic Blvd Unit A
- 385 S Atlantic Blvd Unit B
- 385 S Atlantic Blvd Unit C
- 385 S Atlantic Blvd Unit D
- 388 De la Fuente St
- 326 De la Fuente St
- 344 De la Fuente St
- 346 De la Fuente St