365 Santa Clara St Stockton, CA 95207
Lincoln Village NeighborhoodEstimated Value: $252,000 - $481,000
4
Beds
2
Baths
1,842
Sq Ft
$212/Sq Ft
Est. Value
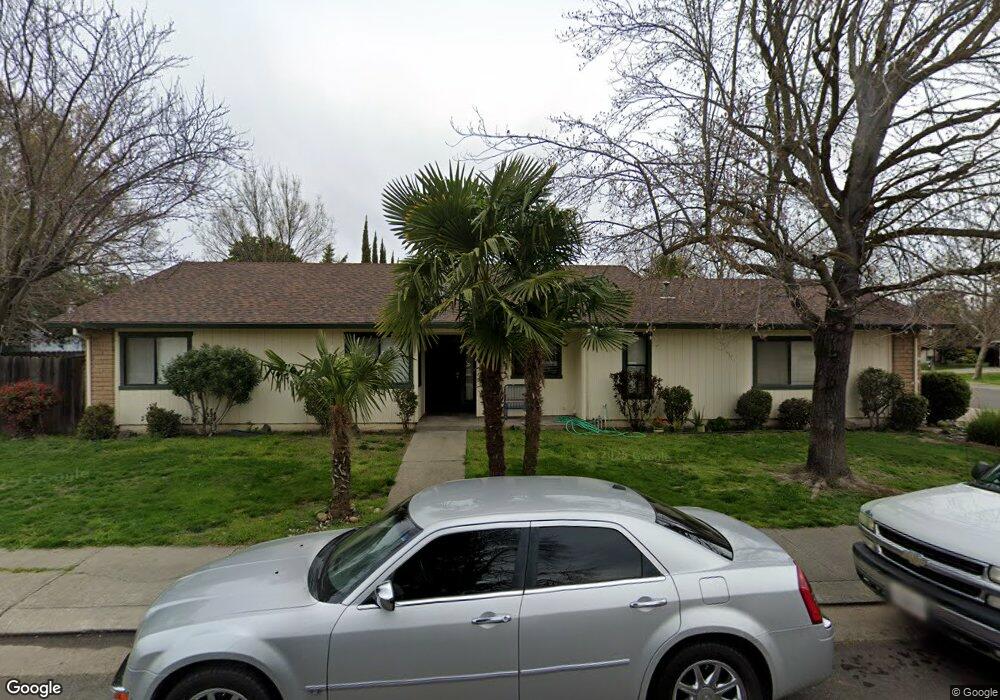
About This Home
This home is located at 365 Santa Clara St, Stockton, CA 95207 and is currently estimated at $390,549, approximately $212 per square foot. 365 Santa Clara St is a home located in San Joaquin County with nearby schools including Adams Elementary School, Maxine Hong Kingston Elementary School, and Pulliam Elementary School.
Ownership History
Date
Name
Owned For
Owner Type
Purchase Details
Closed on
Nov 20, 1997
Sold by
Pinheiro Larry W and Pinheiro Cynthia E
Bought by
Pinheiro Larry W
Current Estimated Value
Home Financials for this Owner
Home Financials are based on the most recent Mortgage that was taken out on this home.
Original Mortgage
$102,393
Outstanding Balance
$16,879
Interest Rate
7.33%
Mortgage Type
FHA
Estimated Equity
$373,670
Purchase Details
Closed on
Jan 27, 1995
Sold by
Hud
Bought by
Pinheiro Larry W
Home Financials for this Owner
Home Financials are based on the most recent Mortgage that was taken out on this home.
Original Mortgage
$104,141
Interest Rate
9.28%
Mortgage Type
FHA
Purchase Details
Closed on
Jul 1, 1994
Sold by
Sonoma Conveyancing Corp
Bought by
California Housing Finance Agency
Create a Home Valuation Report for This Property
The Home Valuation Report is an in-depth analysis detailing your home's value as well as a comparison with similar homes in the area
Home Values in the Area
Average Home Value in this Area
Purchase History
| Date | Buyer | Sale Price | Title Company |
|---|---|---|---|
| Pinheiro Larry W | -- | First American Title Co | |
| Pinheiro Larry W | $105,000 | Central Valley Title Co | |
| California Housing Finance Agency | $92,592 | Fidelity National Title Co | |
| Hud | -- | Fidelity National Title Co |
Source: Public Records
Mortgage History
| Date | Status | Borrower | Loan Amount |
|---|---|---|---|
| Open | Pinheiro Larry W | $102,393 | |
| Closed | Pinheiro Larry W | $104,141 |
Source: Public Records
Tax History Compared to Growth
Tax History
| Year | Tax Paid | Tax Assessment Tax Assessment Total Assessment is a certain percentage of the fair market value that is determined by local assessors to be the total taxable value of land and additions on the property. | Land | Improvement |
|---|---|---|---|---|
| 2025 | $2,353 | $194,825 | $58,779 | $136,046 |
| 2024 | $2,314 | $191,006 | $57,627 | $133,379 |
| 2023 | $2,261 | $187,262 | $56,498 | $130,764 |
| 2022 | $2,209 | $183,591 | $55,391 | $128,200 |
| 2021 | $2,121 | $179,992 | $54,305 | $125,687 |
| 2020 | $2,161 | $178,148 | $53,749 | $124,399 |
| 2019 | $2,151 | $174,656 | $52,696 | $121,960 |
| 2018 | $2,110 | $171,232 | $51,663 | $119,569 |
| 2017 | $1,997 | $167,875 | $50,650 | $117,225 |
| 2016 | $2,032 | $164,584 | $49,657 | $114,927 |
| 2014 | $1,931 | $158,936 | $47,953 | $110,983 |
Source: Public Records
Map
Nearby Homes
- 7638 Santa Ines Ct
- 220 San Carlos Way
- 327 Arc Ave
- 332 Jean Ave
- 8013 El Cajon St
- 518 W Lincoln Rd
- 7015 N El Dorado St
- 148 Bernice Ave
- 36 Lynda Ave
- 6905 N El Dorado St
- 8305 Dunbarton Way
- 103 Cordova Ln
- 1001 W Lincoln Rd Unit C
- 8306 Galloway Dr
- 7 W Loretta Ave
- 8160 Encino Ave
- 7941 Diana Marie Dr
- 764 Macduff Ave
- 352 Jill Cir
- 6510 N El Dorado St
- 357 Santa Clara St
- 373 Santa Clara St
- 427 Santa Clara St
- 7620 Santa Ines Ct
- 351 Santa Clara St
- 7606 Santa Ines Ct
- 509 Santa Clara St
- 317 Santa Clara St
- 325 Santa Clara St
- 7630 Santa Ines Ct
- 343 Santa Clara St
- 517 Santa Clara St
- 406 Santa Clara St
- 418 Santa Clara St
- 339 Santa Clara St
- 331 Santa Clara St
- 346 Santa Clara St
- 430 Santa Clara St
- 7607 Santa Ines Ct
- 320 Santa Clara St