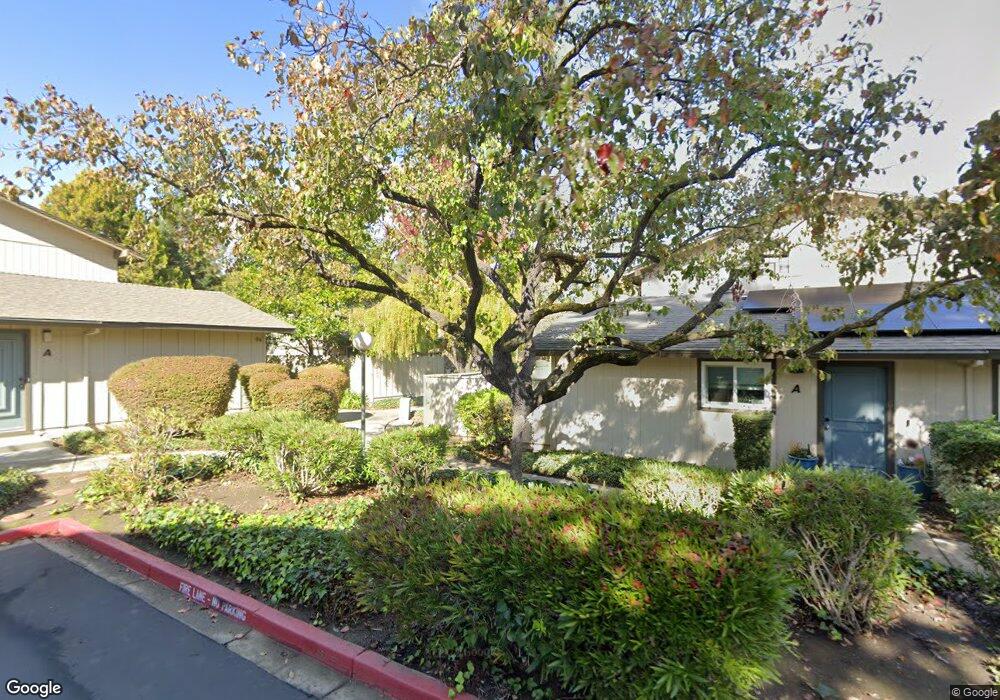
365 Tyrella Ave Unit D Mountain View, CA 94043
Whisman NeighborhoodEstimated Value: $688,412 - $968,000
2
Beds
1
Bath
905
Sq Ft
$894/Sq Ft
Est. Value
About This Home
This home is located at 365 Tyrella Ave Unit D, Mountain View, CA 94043 and is currently estimated at $809,103, approximately $894 per square foot. 365 Tyrella Ave Unit D is a home located in Santa Clara County with nearby schools including Amy Imai Elementary School, Crittenden Middle School, and Mountain View High School.
Ownership History
Date
Name
Owned For
Owner Type
Purchase Details
Closed on
Mar 14, 2008
Sold by
Eliou Zoi Dorit
Bought by
Zhang Ping
Current Estimated Value
Home Financials for this Owner
Home Financials are based on the most recent Mortgage that was taken out on this home.
Original Mortgage
$305,350
Outstanding Balance
$187,766
Interest Rate
5.5%
Mortgage Type
Purchase Money Mortgage
Estimated Equity
$621,337
Purchase Details
Closed on
Mar 5, 1996
Sold by
Federal National Mortgage Association
Bought by
Steinmetz Adele
Home Financials for this Owner
Home Financials are based on the most recent Mortgage that was taken out on this home.
Original Mortgage
$127,050
Interest Rate
6.98%
Mortgage Type
Seller Take Back
Purchase Details
Closed on
Jun 7, 1995
Sold by
Scott Rod and Federal National Mortgage Asso
Bought by
Federal National Mortgage Association
Create a Home Valuation Report for This Property
The Home Valuation Report is an in-depth analysis detailing your home's value as well as a comparison with similar homes in the area
Home Values in the Area
Average Home Value in this Area
Purchase History
| Date | Buyer | Sale Price | Title Company |
|---|---|---|---|
| Zhang Ping | -- | Old Republic Title Company | |
| Steinmetz Adele | $131,000 | Old Republic Title Company | |
| Federal National Mortgage Association | $122,519 | First American Title Ins Co |
Source: Public Records
Mortgage History
| Date | Status | Borrower | Loan Amount |
|---|---|---|---|
| Open | Zhang Ping | $305,350 | |
| Previous Owner | Steinmetz Adele | $127,050 |
Source: Public Records
Tax History
| Year | Tax Paid | Tax Assessment Tax Assessment Total Assessment is a certain percentage of the fair market value that is determined by local assessors to be the total taxable value of land and additions on the property. | Land | Improvement |
|---|---|---|---|---|
| 2025 | $5,996 | $510,944 | $255,472 | $255,472 |
| 2024 | $5,996 | $500,926 | $250,463 | $250,463 |
| 2023 | $5,996 | $491,104 | $245,552 | $245,552 |
| 2022 | $5,917 | $481,476 | $240,738 | $240,738 |
| 2021 | $5,775 | $472,036 | $236,018 | $236,018 |
| 2020 | $5,781 | $467,196 | $233,598 | $233,598 |
| 2019 | $5,542 | $458,036 | $229,018 | $229,018 |
| 2018 | $5,492 | $449,056 | $224,528 | $224,528 |
| 2017 | $5,270 | $440,252 | $220,126 | $220,126 |
| 2016 | $5,076 | $431,620 | $215,810 | $215,810 |
| 2015 | $4,933 | $425,138 | $212,569 | $212,569 |
| 2014 | $4,889 | $416,812 | $208,406 | $208,406 |
Source: Public Records
Map
Nearby Homes
- 94 Flynn Ave Unit D
- 100 E Middlefield Rd Unit 6G
- 108 E Middlefield Rd Unit A
- 104 E Middlefield Rd Unit B
- 248 Walker Dr Unit 17
- 280 Easy St Unit 406
- 280 Easy St Unit 403
- 17 Cassandra Way
- 83 Devonshire Ave Unit 7
- 107 Evandale Ave Unit 9
- 651 Cinnamon Cir
- 619 Cinnamon Cir
- 268 Ariana Place
- 500 W Middlefield Rd Unit 121
- 500 W Middlefield Rd Unit 122
- 847 San Luppe Dr
- 119 Easy St Unit 7
- 505 Cypress Point Dr Unit 140
- 505 Cypress Point Dr Unit 40
- 440 Moffett Blvd Unit 86
- 365 Tyrella Ave
- 365 Tyrella Ave Unit C
- 365 Tyrella Ave Unit B
- 365 Tyrella Ave Unit A
- 94 Flynn Ave Unit D
- 94 Flynn Ave Unit C
- 94 Flynn Ave Unit B
- 94 Flynn Ave Unit A
- 98 Flynn Ave Unit D
- 98 Flynn Ave Unit C
- 98 Flynn Ave Unit B
- 98 Flynn Ave Unit A
- 363 Tyrella Ave Unit D
- 363 Tyrella Ave Unit C
- 363 Tyrella Ave Unit B
- 363 Tyrella Ave Unit A
- 361 Tyrella Ave Unit A
- 361 Tyrella Ave Unit D
- 361 Tyrella Ave Unit C
- 361 Tyrella Ave Unit B
Your Personal Tour Guide
Ask me questions while you tour the home.