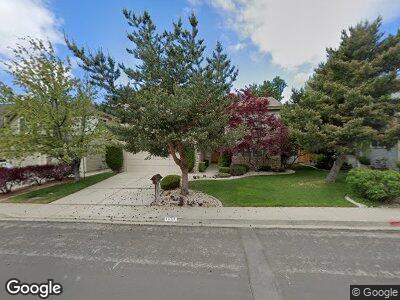
3651 Crestridge Way Reno, NV 89509
West Plumb-Cashill Boulevard NeighborhoodEstimated Value: $747,000 - $854,000
3
Beds
3
Baths
2,386
Sq Ft
$331/Sq Ft
Est. Value
About This Home
This home is located at 3651 Crestridge Way, Reno, NV 89509 and is currently estimated at $790,931, approximately $331 per square foot. 3651 Crestridge Way is a home located in Washoe County with nearby schools including Caughlin Ranch Elementary School, Darrell C Swope Middle School, and Reno High School.
Ownership History
Date
Name
Owned For
Owner Type
Purchase Details
Closed on
Jul 31, 2006
Sold by
Dulani Subhash A and Dulani Divya S
Bought by
Bogal Jason H
Current Estimated Value
Home Financials for this Owner
Home Financials are based on the most recent Mortgage that was taken out on this home.
Original Mortgage
$352,800
Interest Rate
6.76%
Mortgage Type
Unknown
Purchase Details
Closed on
Sep 18, 2003
Sold by
Rowan Daniel and Rowan Amy
Bought by
Dulani Subhash A and Dulani Divya S
Home Financials for this Owner
Home Financials are based on the most recent Mortgage that was taken out on this home.
Original Mortgage
$288,000
Interest Rate
4.87%
Mortgage Type
Unknown
Purchase Details
Closed on
Oct 21, 2002
Sold by
Miller David G and Miller Heidi N
Bought by
Rowan Daniel and Rowan Amy
Home Financials for this Owner
Home Financials are based on the most recent Mortgage that was taken out on this home.
Original Mortgage
$270,750
Interest Rate
6.09%
Create a Home Valuation Report for This Property
The Home Valuation Report is an in-depth analysis detailing your home's value as well as a comparison with similar homes in the area
Home Values in the Area
Average Home Value in this Area
Purchase History
| Date | Buyer | Sale Price | Title Company |
|---|---|---|---|
| Bogal Jason H | $441,000 | First American Title | |
| Dulani Subhash A | $902,000 | Stewart Title Of Northern Nv | |
| Rowan Daniel | $285,000 | Stewart Title Northern Nevad |
Source: Public Records
Mortgage History
| Date | Status | Borrower | Loan Amount |
|---|---|---|---|
| Open | Bogal Jason H | $307,850 | |
| Closed | Bogal Jason H | $352,800 | |
| Previous Owner | Dulani Subhash A | $102,000 | |
| Previous Owner | Dulani Subhash A | $288,000 | |
| Previous Owner | Rowan Daniel | $270,750 |
Source: Public Records
Tax History Compared to Growth
Tax History
| Year | Tax Paid | Tax Assessment Tax Assessment Total Assessment is a certain percentage of the fair market value that is determined by local assessors to be the total taxable value of land and additions on the property. | Land | Improvement |
|---|---|---|---|---|
| 2025 | $3,805 | $152,694 | $69,055 | $83,640 |
| 2024 | $3,654 | $152,156 | $67,060 | $85,096 |
| 2023 | $3,654 | $143,514 | $63,280 | $80,234 |
| 2022 | $3,549 | $115,179 | $47,705 | $67,474 |
| 2021 | $3,445 | $102,649 | $35,000 | $67,649 |
| 2020 | $3,342 | $103,308 | $35,000 | $68,308 |
| 2019 | $3,245 | $99,198 | $32,550 | $66,648 |
| 2018 | $3,151 | $91,754 | $26,250 | $65,504 |
| 2017 | $3,059 | $92,254 | $26,250 | $66,004 |
| 2016 | $2,982 | $89,804 | $22,435 | $67,369 |
| 2015 | $2,978 | $86,973 | $19,215 | $67,758 |
| 2014 | $2,846 | $80,499 | $15,890 | $64,609 |
| 2013 | -- | $75,296 | $11,515 | $63,781 |
Source: Public Records
Map
Nearby Homes
- 3658 Hemlock Way
- 3880 Royer Ct
- 3805 Cashill Blvd
- 2790 W Lakeridge Shores
- 3601 Hemlock Way
- 4700 Aberfeldy Rd
- 3678 Brighton Way
- 2593 Chaparral Ct
- 3468 San Juan Cir
- 3315 Markridge Dr
- 2382 Silver Ridge Dr
- 4822 RaMcReek Trail
- 4826 RaMcReek Trail
- 4040 S Westpoint Dr
- 3390 Cashill Blvd
- 0 Meridian Ln Unit 240012263
- 3365 Marthiam Ave
- 3590 Bluejay Ct
- 4795 Buckhaven Ct
- 4875 Mountainshyre Rd
- 3651 Crestridge Way
- 3653 Crestridge Way
- 3641 Crestridge Way
- 3894 Cashill Blvd
- 3657 Crestridge Way
- 3648 Crestridge Way
- 3896 Cashill Blvd
- 3652 Crestridge Way
- 3640 Crestridge Way
- 3654 Crestridge Way
- 3659 Crestridge Way
- 3896 Vistacrest Dr
- 3898 Cashill Blvd
- 3656 Crestridge Way
- 3891 Cashill Blvd
- 3898 Vistacrest Dr
- 3893 Cashill Blvd
- 3889 Cashill Blvd
- 3894 Vistacrest Dr
- 3648 Hemlock Way