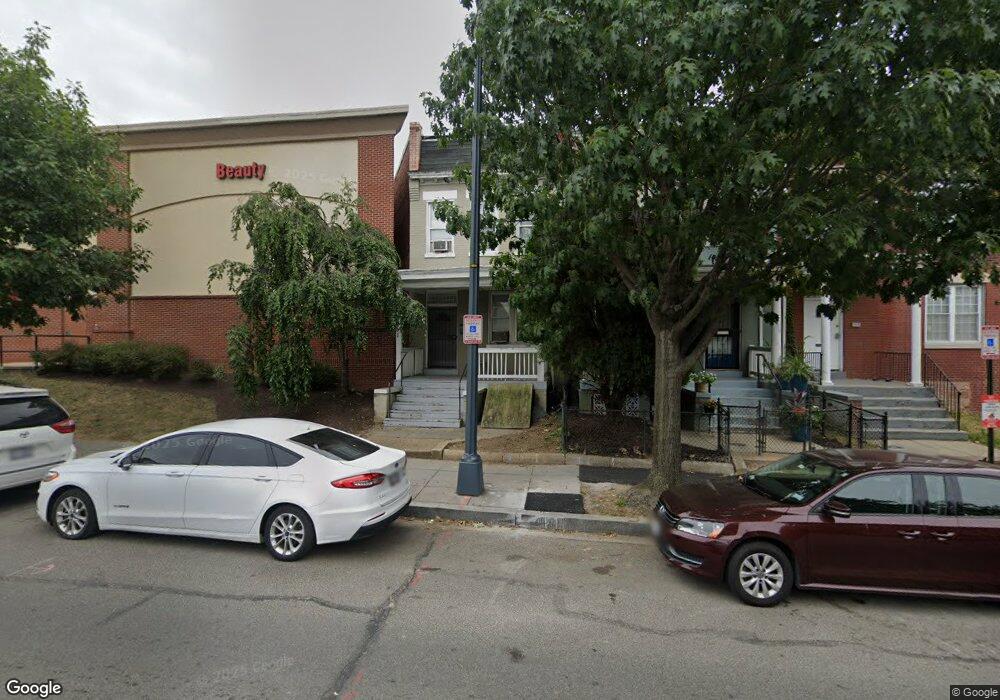
3651 New Hampshire Ave NW Washington, DC 20010
Park View NeighborhoodEstimated Value: $758,308 - $841,000
3
Beds
2
Baths
1,908
Sq Ft
$413/Sq Ft
Est. Value
About This Home
This home is located at 3651 New Hampshire Ave NW, Washington, DC 20010 and is currently estimated at $788,827, approximately $413 per square foot. 3651 New Hampshire Ave NW is a home located in District of Columbia with nearby schools including Raymond Education Campus, MacFarland Middle School, and Roosevelt High School @ MacFarland.
Ownership History
Date
Name
Owned For
Owner Type
Purchase Details
Closed on
Apr 5, 2018
Sold by
3651 New Hampshire Avenue Nw Llc A Distr
Bought by
Bny Development 2 Llc
Current Estimated Value
Home Financials for this Owner
Home Financials are based on the most recent Mortgage that was taken out on this home.
Original Mortgage
$487,500
Outstanding Balance
$417,946
Interest Rate
4.4%
Mortgage Type
Commercial
Estimated Equity
$370,881
Purchase Details
Closed on
Sep 20, 2006
Sold by
Robin Enterprises Inc
Bought by
3651 New Hampshire Ave Nw
Purchase Details
Closed on
Aug 22, 2001
Sold by
Robin Enterprises Inc
Bought by
3651 New Hampshire Avenue N W
Home Financials for this Owner
Home Financials are based on the most recent Mortgage that was taken out on this home.
Original Mortgage
$70,000
Interest Rate
7.21%
Create a Home Valuation Report for This Property
The Home Valuation Report is an in-depth analysis detailing your home's value as well as a comparison with similar homes in the area
Home Values in the Area
Average Home Value in this Area
Purchase History
| Date | Buyer | Sale Price | Title Company |
|---|---|---|---|
| Bny Development 2 Llc | $650,000 | Stewart Title Guaranty Co | |
| 3651 New Hampshire Ave Nw | $15,702 | -- | |
| 3651 New Hampshire Avenue N W | $70,000 | -- |
Source: Public Records
Mortgage History
| Date | Status | Borrower | Loan Amount |
|---|---|---|---|
| Open | Bny Development 2 Llc | $487,500 | |
| Previous Owner | 3651 New Hampshire Avenue N W | $70,000 |
Source: Public Records
Tax History Compared to Growth
Tax History
| Year | Tax Paid | Tax Assessment Tax Assessment Total Assessment is a certain percentage of the fair market value that is determined by local assessors to be the total taxable value of land and additions on the property. | Land | Improvement |
|---|---|---|---|---|
| 2025 | $6,437 | $757,260 | $459,160 | $298,100 |
| 2024 | $6,360 | $748,230 | $454,550 | $293,680 |
| 2023 | $6,316 | $743,100 | $451,040 | $292,060 |
| 2022 | $5,889 | $692,800 | $429,330 | $263,470 |
| 2021 | $5,752 | $676,760 | $422,980 | $253,780 |
| 2020 | $5,628 | $662,150 | $422,920 | $239,230 |
| 2019 | $5,429 | $638,670 | $400,160 | $238,510 |
| 2018 | $5,197 | $611,360 | $0 | $0 |
| 2017 | $4,931 | $580,150 | $0 | $0 |
| 2016 | $4,374 | $514,640 | $0 | $0 |
| 2015 | $3,898 | $458,600 | $0 | $0 |
| 2014 | $3,183 | $374,450 | $0 | $0 |
Source: Public Records
Map
Nearby Homes
- 3633 New Hampshire Ave NW
- 3644 New Hampshire Ave NW
- 3624 Rock Creek Church Rd NW
- 3619 Georgia Ave NW Unit 405
- 739 Newton Place NW Unit 104
- 3656 New Hampshire Ave NW Unit 4
- 3656 New Hampshire Ave NW Unit 3
- 747 Newton Place NW
- 765 Princeton Place NW
- 3540 Rock Creek Church Rd NW Unit 303
- 3563 10th St NW
- 3521 New Hampshire Ave NW
- 825 Rock Creek Church Rd NW
- 749 Princeton Place NW
- 755 Quebec Place NW
- 743 Princeton Place NW
- 615 Newton Place NW
- 707 Otis Place NW
- 3728 9th St NW
- 718 Park Rd NW Unit 6
- 3649 New Hampshire Ave NW
- 3647 New Hampshire Ave NW Unit 1
- 3647 New Hampshire Ave NW Unit 2
- 3647 New Hampshire Ave NW
- 3642 Georgia Ave NW
- 3646 Georgia Ave NW
- 3636 Georgia Ave NW
- 820 Princeton Place NW
- 822 Princeton Place NW
- 3639 New Hampshire Ave NW Unit B
- 3639 New Hampshire Ave NW
- 3634 Georgia Ave NW Unit 2ND FLOOR
- 3634 Georgia Ave NW Unit 3RD FLOOR
- 3634 Georgia Ave NW Unit A
- 3634 Georgia Ave NW Unit A/B
- 3634 Georgia Ave NW
- 3632 Georgia Ave NW
- 3637 New Hampshire Ave NW
- 3628 Georgia Ave NW Unit P-2
- 3628 Georgia Ave NW Unit 4