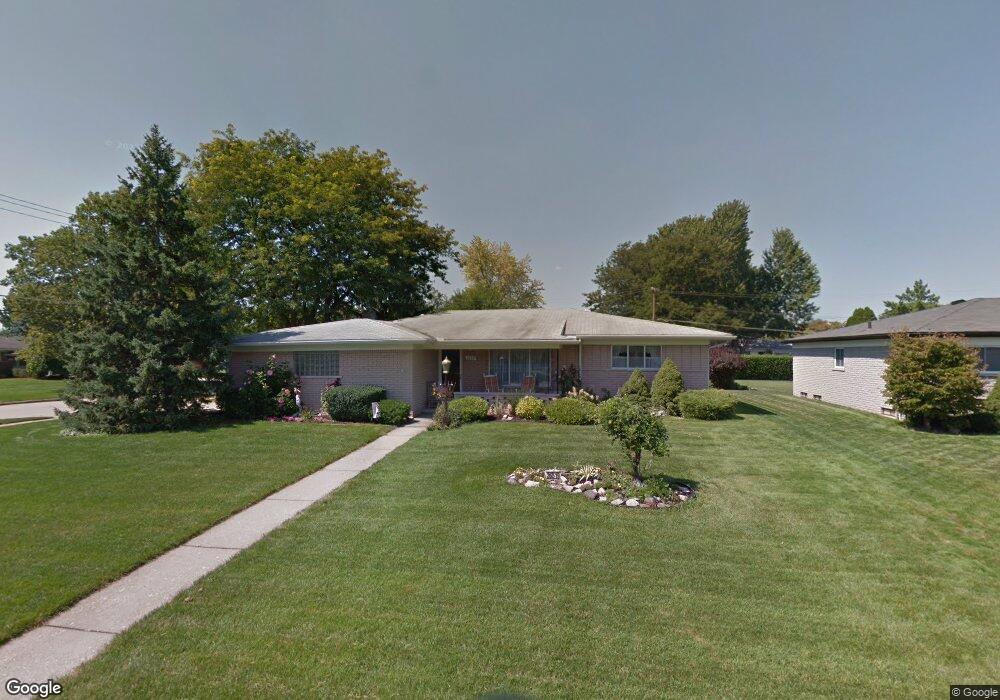
36519 Ridgecroft Dr Unit Bldg-Unit Sterling Heights, MI 48312
Estimated Value: $328,023 - $341,000
--
Bed
2
Baths
1,765
Sq Ft
$190/Sq Ft
Est. Value
About This Home
This home is located at 36519 Ridgecroft Dr Unit Bldg-Unit, Sterling Heights, MI 48312 and is currently estimated at $335,756, approximately $190 per square foot. 36519 Ridgecroft Dr Unit Bldg-Unit is a home located in Macomb County with nearby schools including Bruce Collins Elementary School, Heritage Junior High School, and Adlai Stevenson High School.
Ownership History
Date
Name
Owned For
Owner Type
Purchase Details
Closed on
Jul 17, 2018
Sold by
Asmaro Rolin and Asmaro Rownal
Bought by
Hanna Mouwafaq
Current Estimated Value
Purchase Details
Closed on
Jun 2, 2017
Sold by
Cornie Bernadine and Delling Constance M
Bought by
Asmaro Rob and Asmaro Rownal
Home Financials for this Owner
Home Financials are based on the most recent Mortgage that was taken out on this home.
Original Mortgage
$191,576
Interest Rate
4.05%
Mortgage Type
FHA
Purchase Details
Closed on
Sep 14, 2012
Sold by
Gornie Bernadine
Bought by
Gornie Bernadine and Delling Constance M
Purchase Details
Closed on
Jun 22, 2004
Sold by
Gornie David V and Gornie Bernadine
Bought by
Gornie David V and Gornie Bernadine
Create a Home Valuation Report for This Property
The Home Valuation Report is an in-depth analysis detailing your home's value as well as a comparison with similar homes in the area
Home Values in the Area
Average Home Value in this Area
Purchase History
| Date | Buyer | Sale Price | Title Company |
|---|---|---|---|
| Hanna Mouwafaq | $210,000 | Ata National Title Group Llc | |
| Asmaro Rob | $195,111 | Fidelity National Title | |
| Gornie Bernadine | -- | None Available | |
| Gornie Bernadine | -- | None Available | |
| Gornie David V | -- | None Available | |
| Gornie David V | $215,000 | Lighthouse Title Agency |
Source: Public Records
Mortgage History
| Date | Status | Borrower | Loan Amount |
|---|---|---|---|
| Previous Owner | Asmaro Rob | $191,576 |
Source: Public Records
Tax History Compared to Growth
Tax History
| Year | Tax Paid | Tax Assessment Tax Assessment Total Assessment is a certain percentage of the fair market value that is determined by local assessors to be the total taxable value of land and additions on the property. | Land | Improvement |
|---|---|---|---|---|
| 2025 | $4,621 | $155,200 | $0 | $0 |
| 2024 | $4,226 | $142,700 | $0 | $0 |
| 2023 | $3,990 | $128,100 | $0 | $0 |
| 2022 | $4,159 | $117,500 | $0 | $0 |
| 2021 | $4,073 | $109,800 | $0 | $0 |
| 2020 | $3,633 | $107,700 | $0 | $0 |
| 2019 | $3,722 | $102,200 | $0 | $0 |
| 2018 | $3,507 | $94,100 | $0 | $0 |
| 2017 | $2,670 | $87,800 | $17,700 | $70,100 |
| 2016 | $2,579 | $87,800 | $0 | $0 |
| 2015 | -- | $80,200 | $0 | $0 |
| 2014 | -- | $72,100 | $0 | $0 |
Source: Public Records
Map
Nearby Homes
- 36719 Gregory Dr
- 36754 Maas Dr
- 36819 Maas Dr
- 37096 Gregory Dr
- 8469 Heywood Cir Unit 58
- 13193 Metro Pkwy
- 36460 Tarpon Dr
- 35517 Turner Dr Unit 237
- 37608 Andrew Dr
- 36876 Aaron Ct
- 8982 Shawn Dr Unit 222
- 35276 Terrybrook Dr Unit 186
- 35695 Bonneville Dr
- 35112 Kensington Ave
- 35122 Terrybrook Dr Unit 20
- 12245 Canterbury Dr
- 8852 Sunrise Dr Unit 4
- 35080 Wellston Ave
- 12341 de Grove Dr
- 11025 16 1 2 Mile Rd
- 36519 Ridgecroft Dr
- 36539 Ridgecroft Dr
- 36524 Gregory Dr
- 36556 Gregory Dr
- 36557 Ridgecroft Dr
- 11132 Greendale Dr
- 11114 Greendale Dr
- 36520 Ridgecroft Dr
- 36538 Ridgecroft Dr
- 36588 Gregory Dr
- 11150 Greendale Dr
- 36470 Gregory Dr
- 36575 Ridgecroft Dr
- 36556 Ridgecroft Dr
- 11168 Greendale Dr
- 36622 Gregory Dr
- 36456 Gregory Dr
- 11147 Laurel Ct
- 36574 Ridgecroft Dr
- 36521 Tulane Dr