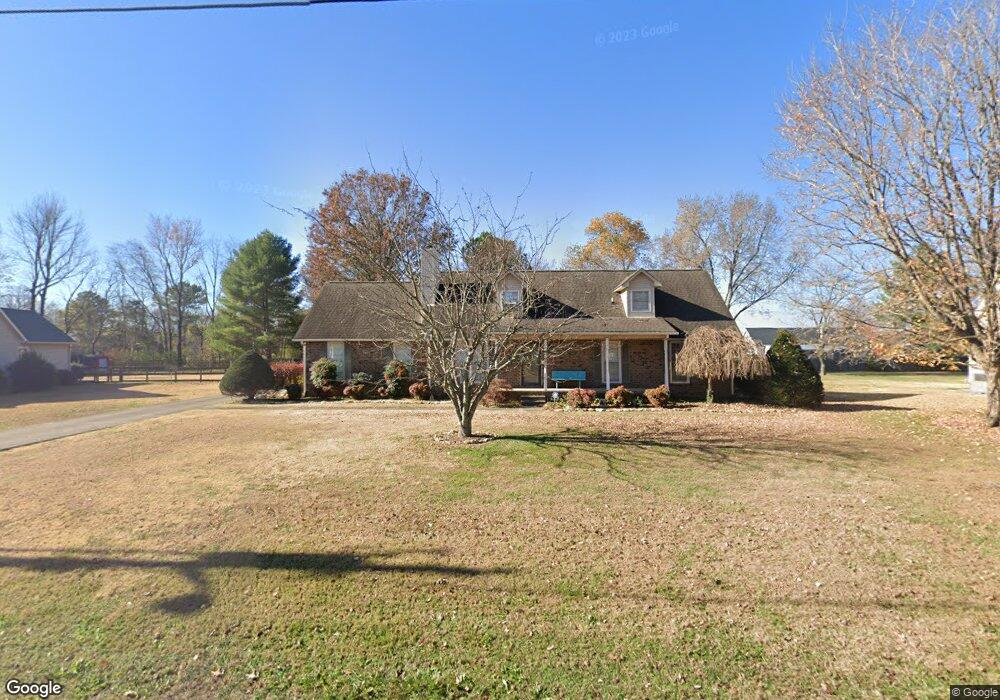
3655 Sugarbush Ct Murfreesboro, TN 37127
Estimated Value: $397,674 - $533,000
--
Bed
2
Baths
2,234
Sq Ft
$206/Sq Ft
Est. Value
About This Home
This home is located at 3655 Sugarbush Ct, Murfreesboro, TN 37127 and is currently estimated at $459,419, approximately $205 per square foot. 3655 Sugarbush Ct is a home located in Rutherford County with nearby schools including Buchanan Elementary School, Whitworth-Buchanan Middle School, and Riverdale High School.
Ownership History
Date
Name
Owned For
Owner Type
Purchase Details
Closed on
Apr 7, 2007
Sold by
Deanna Vanek
Bought by
Vanek Kenneth J
Current Estimated Value
Purchase Details
Closed on
Sep 4, 2001
Sold by
Brasky Stacy
Bought by
Vanek Kenneth J and Vanek Deanna
Home Financials for this Owner
Home Financials are based on the most recent Mortgage that was taken out on this home.
Original Mortgage
$112,700
Interest Rate
6.98%
Purchase Details
Closed on
May 16, 1994
Sold by
Johnson Mary C
Bought by
Basky Stacy
Create a Home Valuation Report for This Property
The Home Valuation Report is an in-depth analysis detailing your home's value as well as a comparison with similar homes in the area
Home Values in the Area
Average Home Value in this Area
Purchase History
| Date | Buyer | Sale Price | Title Company |
|---|---|---|---|
| Vanek Kenneth J | $40,000 | -- | |
| Vanek Kenneth J | $112,700 | -- | |
| Basky Stacy | -- | -- |
Source: Public Records
Mortgage History
| Date | Status | Borrower | Loan Amount |
|---|---|---|---|
| Previous Owner | Basky Stacy | $112,700 |
Source: Public Records
Tax History Compared to Growth
Tax History
| Year | Tax Paid | Tax Assessment Tax Assessment Total Assessment is a certain percentage of the fair market value that is determined by local assessors to be the total taxable value of land and additions on the property. | Land | Improvement |
|---|---|---|---|---|
| 2025 | $1,616 | $86,125 | $13,750 | $72,375 |
| 2024 | $1,616 | $86,125 | $13,750 | $72,375 |
| 2023 | $1,616 | $86,125 | $13,750 | $72,375 |
| 2022 | $1,382 | $85,500 | $13,750 | $71,750 |
| 2021 | $1,268 | $57,125 | $8,125 | $49,000 |
| 2020 | $1,268 | $57,125 | $8,125 | $49,000 |
| 2019 | $1,268 | $57,125 | $8,125 | $49,000 |
| 2018 | $1,199 | $57,125 | $0 | $0 |
| 2017 | $916 | $34,175 | $0 | $0 |
| 2016 | $916 | $34,175 | $0 | $0 |
| 2015 | $916 | $34,175 | $0 | $0 |
| 2014 | $850 | $34,175 | $0 | $0 |
| 2013 | -- | $31,225 | $0 | $0 |
Source: Public Records
Map
Nearby Homes
- 2410 Lightbend Dr
- 4218 Golden Sun Ct
- 1324 Sunray Dr
- 4203 Sarazen Ln
- 1845 Streamsong Dr
- 1847 Streamsong Dr
- 1843 Streamsong Dr
- 1840 Streamsong Dr
- 4262 Golden Sun Ct
- 4316 Doral Dr
- 4325 Calusa Dr
- 4327 Calusa Dr
- 4329 Calusa Dr
- 4331 Calusa Dr
- 4335 Calusa Dr
- 4337 Calusa Dr
- 4339 Calusa Dr
- 4349 Spyglass Dr
- 4349 Doral Dr
- 4247 Aurora Cir
- 3659 Sugarbush Ct
- 3651 Sugarbush Ct
- 3619 Manchester Pike
- 3625 Manchester Pike
- 3650 Sugarbush Ct
- 3613 Manchester Pike
- 3663 Sugarbush Ct
- 3647 Sugarbush Ct
- 3651 Dilton Mankin Rd
- 3607 Manchester Pike
- 3642 Sugarbush Ct
- 3711 Dilton Mankin Rd
- 3645 Dilton Mankin Rd
- 3641 Sugarbush Ct
- 3639 Dilton Mankin Rd
- 3601 Manchester Pike
- 3759 Manchester Pike
- 3636 Sugarbush Ct
- 3724 Manchester Pike
- 3635 Sugarbush Ct