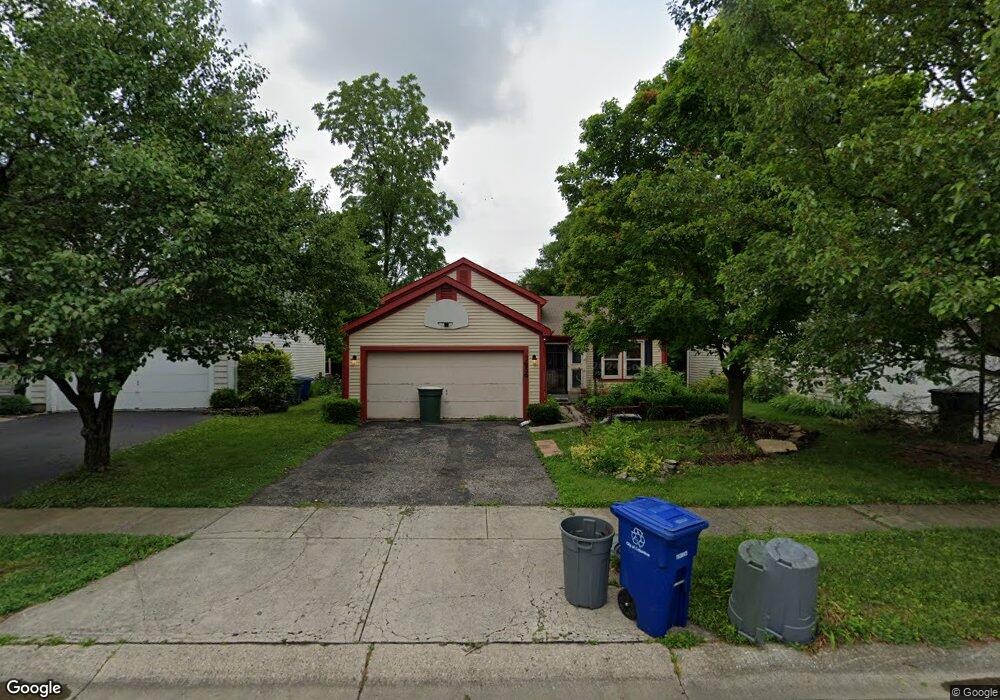
3656 Skipstone Place Columbus, OH 43221
Highpoint-Glen NeighborhoodEstimated Value: $291,000 - $364,000
4
Beds
3
Baths
1,004
Sq Ft
$331/Sq Ft
Est. Value
About This Home
This home is located at 3656 Skipstone Place, Columbus, OH 43221 and is currently estimated at $331,916, approximately $330 per square foot. 3656 Skipstone Place is a home located in Franklin County with nearby schools including Ridgewood Elementary School, Hilliard Tharp Sixth Grade Elementary School, and Hilliard Weaver Middle School.
Ownership History
Date
Name
Owned For
Owner Type
Purchase Details
Closed on
Sep 20, 2002
Sold by
Evans Eric E
Bought by
Evans Eric E and Evans Jena M
Current Estimated Value
Home Financials for this Owner
Home Financials are based on the most recent Mortgage that was taken out on this home.
Original Mortgage
$114,200
Outstanding Balance
$47,984
Interest Rate
6.32%
Estimated Equity
$283,932
Purchase Details
Closed on
May 11, 1999
Sold by
Evans Jena M
Bought by
Evans Eric E
Home Financials for this Owner
Home Financials are based on the most recent Mortgage that was taken out on this home.
Original Mortgage
$114,040
Interest Rate
6.92%
Mortgage Type
FHA
Purchase Details
Closed on
Jun 9, 1997
Sold by
Mcclintock Dale T and Mcclintock Sherylinda S
Bought by
Evans Eric E and Evans Jena M
Home Financials for this Owner
Home Financials are based on the most recent Mortgage that was taken out on this home.
Original Mortgage
$112,474
Interest Rate
8.13%
Mortgage Type
FHA
Purchase Details
Closed on
May 1, 1986
Purchase Details
Closed on
Dec 1, 1983
Create a Home Valuation Report for This Property
The Home Valuation Report is an in-depth analysis detailing your home's value as well as a comparison with similar homes in the area
Home Values in the Area
Average Home Value in this Area
Purchase History
| Date | Buyer | Sale Price | Title Company |
|---|---|---|---|
| Evans Eric E | -- | Chelsea Title Agency | |
| Evans Eric E | -- | Chicago Title | |
| Evans Eric E | $115,000 | Title First Agency Inc | |
| -- | $75,000 | -- | |
| -- | $67,900 | -- |
Source: Public Records
Mortgage History
| Date | Status | Borrower | Loan Amount |
|---|---|---|---|
| Open | Evans Eric E | $114,200 | |
| Closed | Evans Eric E | $114,040 | |
| Previous Owner | Evans Eric E | $112,474 |
Source: Public Records
Tax History Compared to Growth
Tax History
| Year | Tax Paid | Tax Assessment Tax Assessment Total Assessment is a certain percentage of the fair market value that is determined by local assessors to be the total taxable value of land and additions on the property. | Land | Improvement |
|---|---|---|---|---|
| 2024 | $4,308 | $76,270 | $25,970 | $50,300 |
| 2023 | $3,732 | $76,265 | $25,970 | $50,295 |
| 2022 | $4,025 | $65,870 | $13,650 | $52,220 |
| 2021 | $4,021 | $65,870 | $13,650 | $52,220 |
| 2020 | $4,010 | $65,870 | $13,650 | $52,220 |
| 2019 | $3,890 | $54,570 | $10,920 | $43,650 |
| 2018 | $3,511 | $54,570 | $10,920 | $43,650 |
| 2017 | $3,874 | $54,570 | $10,920 | $43,650 |
| 2016 | $3,359 | $43,830 | $11,520 | $32,310 |
| 2015 | $3,149 | $43,830 | $11,520 | $32,310 |
| 2014 | $3,154 | $43,830 | $11,520 | $32,310 |
| 2013 | $1,598 | $43,820 | $11,515 | $32,305 |
Source: Public Records
Map
Nearby Homes
- 3722 Rochfort Bridge Dr
- 3487 Alfred Ct
- 3757 Mill Stream Dr Unit 12
- 3705 Hilliard Station Rd Unit 3705
- 3832 Falls Circle Dr Unit 22
- 3660 Hilliard Station Rd Unit 3660
- 3782 Falls Circle Dr Unit 25
- 3820 Falls Circle Dr
- 3414 Eastwoodlands Trail Unit 3414
- 3429 Eastwoodlands Trail Unit 3429
- 3438 Eastwoodlands Trail Unit 3438
- 3430 Fishinger Mill Dr
- 3245 Summertime Ct Unit 21
- 3246 Summerdale Ln Unit 34
- 3384 Smiley Rd
- 3622 Fishinger Mill Dr Unit 3622
- 3278 Brookview Way Unit 4
- 3434 Fishinger Rd
- 3259 Prairie Gardens Dr
- 3216 Polley Rd
- 3662 Skipstone Place
- 3650 Skipstone Place
- 3674 Skipstone Place
- 3657 Rochfort Bridge Dr
- 3115 Dunlavin Glen Rd
- 3669 Rochfort Bridge Dr
- 3680 Skipstone Place
- 3665 Skipstone Place
- 3671 Skipstone Place
- 3100 Dunlavin Glen Rd
- 3077 Dunlavin Glen Rd
- 3677 Skipstone Place
- 3677 Rochfort Bridge Dr
- 3686 Skipstone Place
- 3627 Rochfort Bridge Dr
- 3626 Skipstone Place
- 3683 Skipstone Place
- 3078 Dunlavin Glen Rd
- 3692 Skipstone Place
- 3069 Dunlavin Glen Rd