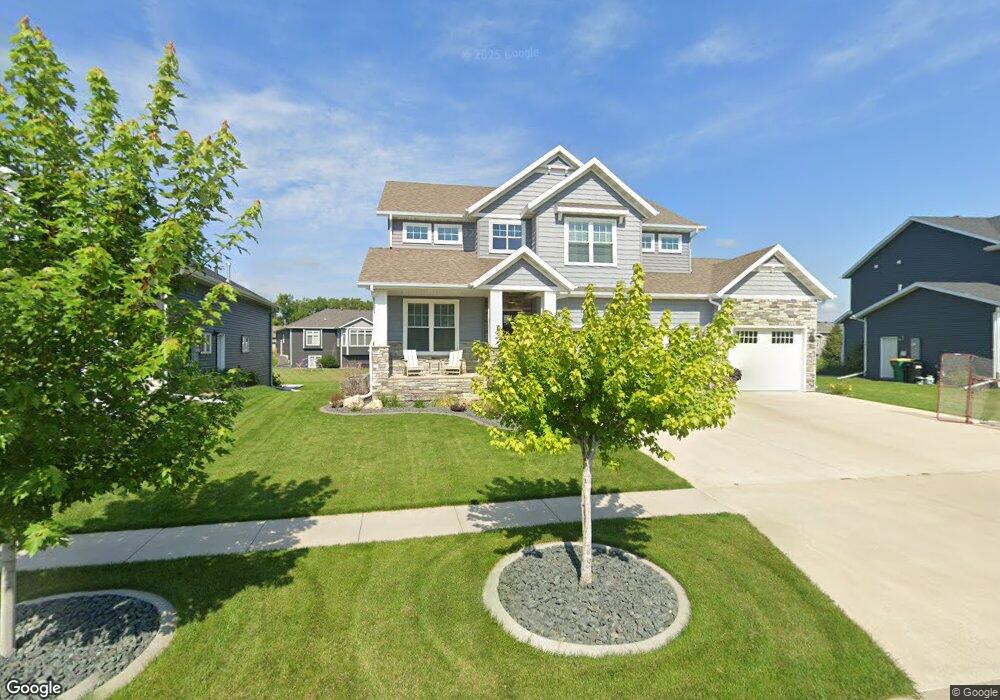
3658 4th St E West Fargo, ND 58078
Shadow Wood-Shadow Creek NeighborhoodEstimated Value: $794,000
5
Beds
3
Baths
3,211
Sq Ft
$247/Sq Ft
Est. Value
About This Home
This home is located at 3658 4th St E, West Fargo, ND 58078 and is currently estimated at $794,000, approximately $247 per square foot. 3658 4th St E is a home with nearby schools including Aurora Elementary School, Liberty Middle School, and West Fargo Sheyenne High School.
Ownership History
Date
Name
Owned For
Owner Type
Purchase Details
Closed on
Oct 23, 2015
Sold by
Carpco Inc Corp
Bought by
Tweten Micah and Tweten Manda
Current Estimated Value
Home Financials for this Owner
Home Financials are based on the most recent Mortgage that was taken out on this home.
Original Mortgage
$30,000
Outstanding Balance
$11,456
Interest Rate
3.91%
Mortgage Type
New Conventional
Estimated Equity
$782,544
Purchase Details
Closed on
Mar 6, 2015
Sold by
Shadow Creek Development Iii Llc
Bought by
Carpco Inc
Create a Home Valuation Report for This Property
The Home Valuation Report is an in-depth analysis detailing your home's value as well as a comparison with similar homes in the area
Home Values in the Area
Average Home Value in this Area
Purchase History
| Date | Buyer | Sale Price | Title Company |
|---|---|---|---|
| Tweten Micah | $630,000 | Regency Title Inc | |
| Carpco Inc | -- | None Available |
Source: Public Records
Mortgage History
| Date | Status | Borrower | Loan Amount |
|---|---|---|---|
| Open | Tweten Micah | $30,000 |
Source: Public Records
Tax History
| Year | Tax Paid | Tax Assessment Tax Assessment Total Assessment is a certain percentage of the fair market value that is determined by local assessors to be the total taxable value of land and additions on the property. | Land | Improvement |
|---|---|---|---|---|
| 2024 | $12,909 | $374,550 | $54,700 | $319,850 |
| 2023 | $13,149 | $353,650 | $54,700 | $298,950 |
| 2022 | $13,060 | $329,400 | $54,700 | $274,700 |
| 2021 | $13,019 | $317,750 | $54,700 | $263,050 |
| 2020 | $12,825 | $313,950 | $54,700 | $259,250 |
| 2019 | $12,992 | $313,600 | $54,700 | $258,900 |
| 2018 | $12,971 | $318,850 | $54,700 | $264,150 |
| 2017 | $12,704 | $318,850 | $54,700 | $264,150 |
| 2016 | $11,792 | $312,750 | $54,700 | $258,050 |
| 2015 | $3,825 | $17,850 | $17,850 | $0 |
| 2014 | $2,218 | $17,850 | $17,850 | $0 |
| 2013 | $1,630 | $200 | $200 | $0 |
Source: Public Records
Map
Nearby Homes
- 3605 Houkom Dr E
- 3702 Houkom Dr E
- 3755 Houkom Dr E
- 3784 Bell Blvd E
- 414 Westview Ln E
- 229 36 1 2 Avenue Place E
- 522 Westview Ln E
- 3463 Loberg Dr
- 436 35th Ave E
- 3878 3rd St E
- 3479 Loberg Ln
- 522 34th Way E
- 6511 Osgood Pkwy S
- 717 35th Ave E
- 3502 8th St E
- 503 33rd Way E Unit B
- 3371 1st St
- 433 Foxtail Dr
- 445 E Foxtail Dr
- 501 Foxtail Dr
- 3664 4th St E
- 3652 4th St E
- 3659 Houkom Dr E
- 3653 Houkom Dr E
- 3670 4th St E
- 3617 Houkom Dr E
- 3623 Houkom Dr E
- 3611 Houkom Dr E
- 3671 Houkom Dr E
- 3653 4th St E
- 3701 Houkom Dr E
- 3664 Houkom Dr E
- 3658 Houkom Dr E
- 3706 4th St E
- 3670 Houkom Dr E
- 0 Shadow Creek St Unit 36433618
- 3707 Houkom Dr E
- 3652 Houkom Dr E
- 3622 Houkom Dr E
- 3676 Houkom Dr E