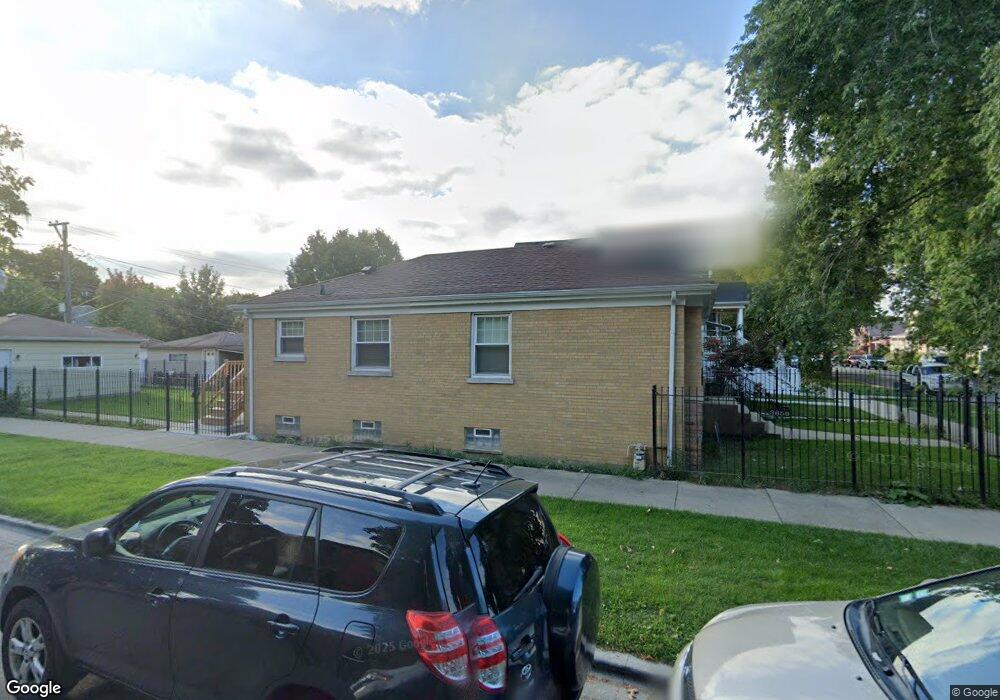
3659 N Richmond St Chicago, IL 60618
Irving Park NeighborhoodEstimated Value: $549,000 - $612,725
2
Beds
2
Baths
899
Sq Ft
$651/Sq Ft
Est. Value
About This Home
This home is located at 3659 N Richmond St, Chicago, IL 60618 and is currently estimated at $585,431, approximately $651 per square foot. 3659 N Richmond St is a home located in Cook County with nearby schools including Cleveland Elementary School, Schurz High School, and CICS Irving Park.
Ownership History
Date
Name
Owned For
Owner Type
Purchase Details
Closed on
Mar 23, 2007
Sold by
Mandina Robert
Bought by
Martinez Luis E and Almeida Yositara C
Current Estimated Value
Home Financials for this Owner
Home Financials are based on the most recent Mortgage that was taken out on this home.
Original Mortgage
$256,000
Outstanding Balance
$154,868
Interest Rate
6.25%
Mortgage Type
Unknown
Estimated Equity
$430,563
Purchase Details
Closed on
Nov 9, 2001
Sold by
Falcon Norma I and Mandina Robert
Bought by
Mandina Robert
Home Financials for this Owner
Home Financials are based on the most recent Mortgage that was taken out on this home.
Original Mortgage
$160,000
Interest Rate
7.26%
Purchase Details
Closed on
Dec 19, 1996
Sold by
Peisker Theresa
Bought by
Mandina Robert and Falcon Norma I
Home Financials for this Owner
Home Financials are based on the most recent Mortgage that was taken out on this home.
Original Mortgage
$116,922
Interest Rate
7.6%
Mortgage Type
FHA
Create a Home Valuation Report for This Property
The Home Valuation Report is an in-depth analysis detailing your home's value as well as a comparison with similar homes in the area
Home Values in the Area
Average Home Value in this Area
Purchase History
| Date | Buyer | Sale Price | Title Company |
|---|---|---|---|
| Martinez Luis E | $320,000 | Heritage Title Company | |
| Mandina Robert | -- | -- | |
| Mandina Robert | $117,000 | -- |
Source: Public Records
Mortgage History
| Date | Status | Borrower | Loan Amount |
|---|---|---|---|
| Open | Martinez Luis E | $256,000 | |
| Previous Owner | Mandina Robert | $160,000 | |
| Previous Owner | Mandina Robert | $116,922 |
Source: Public Records
Tax History Compared to Growth
Tax History
| Year | Tax Paid | Tax Assessment Tax Assessment Total Assessment is a certain percentage of the fair market value that is determined by local assessors to be the total taxable value of land and additions on the property. | Land | Improvement |
|---|---|---|---|---|
| 2024 | $8,345 | $41,694 | $21,278 | $20,416 |
| 2023 | $8,583 | $42,728 | $17,163 | $25,565 |
| 2022 | $8,583 | $45,000 | $17,160 | $27,840 |
| 2021 | $8,408 | $45,003 | $17,163 | $27,840 |
| 2020 | $6,181 | $30,751 | $7,550 | $23,201 |
| 2019 | $6,196 | $34,168 | $7,550 | $26,618 |
| 2018 | $6,090 | $34,168 | $7,550 | $26,618 |
| 2017 | $4,888 | $26,005 | $6,864 | $19,141 |
| 2016 | $4,724 | $26,005 | $6,864 | $19,141 |
| 2015 | $4,300 | $26,005 | $6,864 | $19,141 |
| 2014 | $4,875 | $28,746 | $6,177 | $22,569 |
| 2013 | $4,767 | $28,746 | $6,177 | $22,569 |
Source: Public Records
Map
Nearby Homes
- 3716 N Richmond St
- 3725 N Richmond St
- 3621 N Richmond St
- 3634 N Mozart St
- 2844 W Addison St Unit P1
- 3748 N Sacramento Ave
- 3836 N Richmond St Unit 1N
- 3835 N Francisco Ave
- 3523 N Whipple St
- 3908 N Mozart St
- 3748 N Troy St
- 3100 N Albany Ave
- 3929 N Francisco Ave
- 3801 N Kedzie Ave Unit 1S
- 3815 N Kedzie Ave Unit 3S
- 3024 W Irving Park Rd Unit 1S
- 3911 N Kedzie Ave
- 2714 W Byron St
- 3042 W Irving Park Rd
- 3314 N California Ave
- 3655 N Richmond St
- 3651 N Richmond St
- 3701 N Richmond St
- 3703 N Richmond St
- 3645 N Richmond St
- 3705 N Richmond St
- 9999 N Confidential Ave Unit 999
- 9 N Confidential Ave
- 9999 Confidential Dr
- 0000 N Confidential
- 9999 N Confidential Ave Unit 1
- 3654 N Francisco Ave
- 3641 N Richmond St
- 3650 N Francisco Ave
- 3709 N Richmond St
- 3656 N Francisco Ave
- 3648 N Francisco Ave
- 2910 W Waveland Ave
- 3656 N Richmond St
- 4341 1/2 N Sacramento Ave