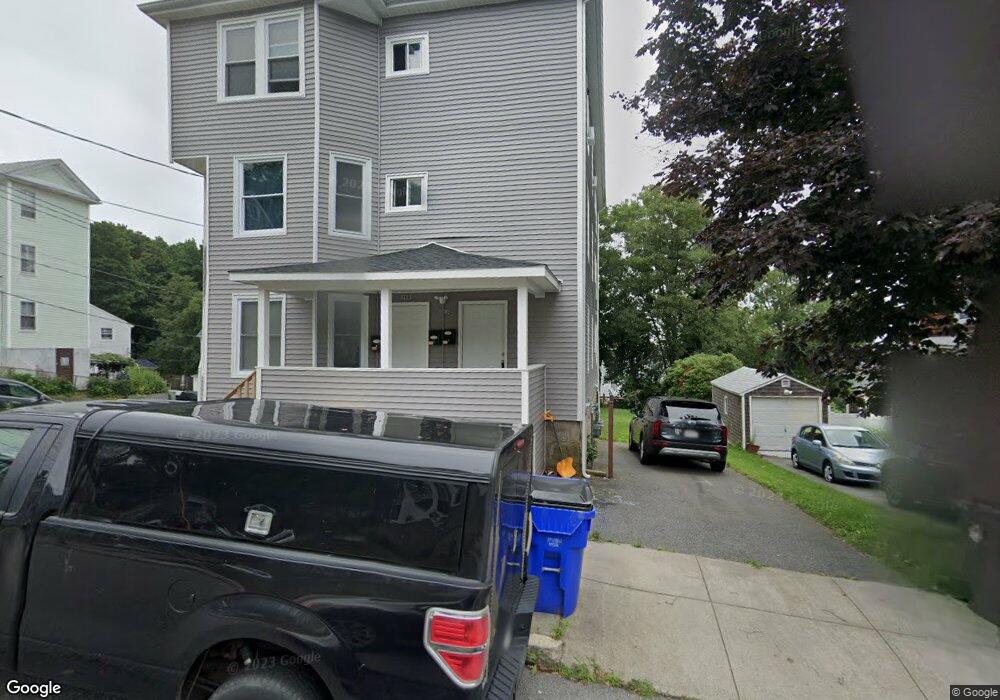
366 Belmont St Fall River, MA 02720
Lower Highlands NeighborhoodEstimated Value: $688,000 - $762,000
9
Beds
3
Baths
4,398
Sq Ft
$167/Sq Ft
Est. Value
About This Home
This home is located at 366 Belmont St, Fall River, MA 02720 and is currently estimated at $736,000, approximately $167 per square foot. 366 Belmont St is a home located in Bristol County with nearby schools including Spencer Borden Elementary School, Morton Middle School, and B M C Durfee High School.
Ownership History
Date
Name
Owned For
Owner Type
Purchase Details
Closed on
Sep 12, 2017
Sold by
Servon Beth H
Bought by
Deutsche Bk Natl T Co
Current Estimated Value
Purchase Details
Closed on
Oct 20, 1998
Sold by
Minkin Evelyn Est
Bought by
Servon Beth H and Bissonnette Robert J
Home Financials for this Owner
Home Financials are based on the most recent Mortgage that was taken out on this home.
Original Mortgage
$135,736
Interest Rate
6.8%
Mortgage Type
Purchase Money Mortgage
Create a Home Valuation Report for This Property
The Home Valuation Report is an in-depth analysis detailing your home's value as well as a comparison with similar homes in the area
Home Values in the Area
Average Home Value in this Area
Purchase History
| Date | Buyer | Sale Price | Title Company |
|---|---|---|---|
| Deutsche Bk Natl T Co | $227,000 | -- | |
| Servon Beth H | $140,000 | -- |
Source: Public Records
Mortgage History
| Date | Status | Borrower | Loan Amount |
|---|---|---|---|
| Previous Owner | Servon Beth H | $262,500 | |
| Previous Owner | Servon Beth H | $215,000 | |
| Previous Owner | Servon Beth H | $135,736 | |
| Closed | Servon Beth H | $5,950 |
Source: Public Records
Tax History Compared to Growth
Tax History
| Year | Tax Paid | Tax Assessment Tax Assessment Total Assessment is a certain percentage of the fair market value that is determined by local assessors to be the total taxable value of land and additions on the property. | Land | Improvement |
|---|---|---|---|---|
| 2025 | $7,578 | $661,800 | $117,500 | $544,300 |
| 2024 | $7,281 | $633,700 | $115,200 | $518,500 |
| 2023 | $6,499 | $529,700 | $103,800 | $425,900 |
| 2022 | $5,772 | $457,400 | $97,900 | $359,500 |
| 2021 | $5,453 | $394,300 | $93,500 | $300,800 |
| 2020 | $4,510 | $312,100 | $89,300 | $222,800 |
| 2019 | $3,958 | $271,500 | $93,300 | $178,200 |
| 2018 | $3,785 | $258,900 | $91,800 | $167,100 |
| 2017 | $3,625 | $258,900 | $91,800 | $167,100 |
| 2016 | $3,541 | $259,800 | $96,700 | $163,100 |
| 2015 | $3,398 | $259,800 | $96,700 | $163,100 |
| 2014 | $3,458 | $274,900 | $96,700 | $178,200 |
Source: Public Records
Map
Nearby Homes
- 503 Highland Ave
- 771 Rock St
- 327 Brownell St
- 33-35 Malvey St
- 195 Barnaby St
- 72 Belmont St
- 1245 N High St
- 1240-1246 N Main St
- 11 Dyer St
- 376 N Underwood St
- 509 N Belmont St
- 884-886 Robeson St
- 213 Weetamoe St
- 110 Weetamoe St
- 100 Weetamoe St
- 302 Cory St
- 65 Bigelow St
- 81 N Court St
- 102 Vestal St
- 342 Stetson St
- 368 Belmont St Unit 3
- 380 Belmont St
- 420 Pearce St
- 342 Belmont St
- 404 Pearce St
- 400 Belmont St
- 413 Pearce St
- 413 Pearce St Unit 1
- 413 Pearce St Unit 2
- 425 Pearce St
- 367 Belmont St
- 35 Mcclure Place
- 332 Belmont St
- 332 Belmont St Unit 2
- 341 Belmont St
- 341 Belmont St Unit 1
- 341 Belmont St Unit 2
- 379 Belmont St
- 389 Belmont St
- 410 Belmont St