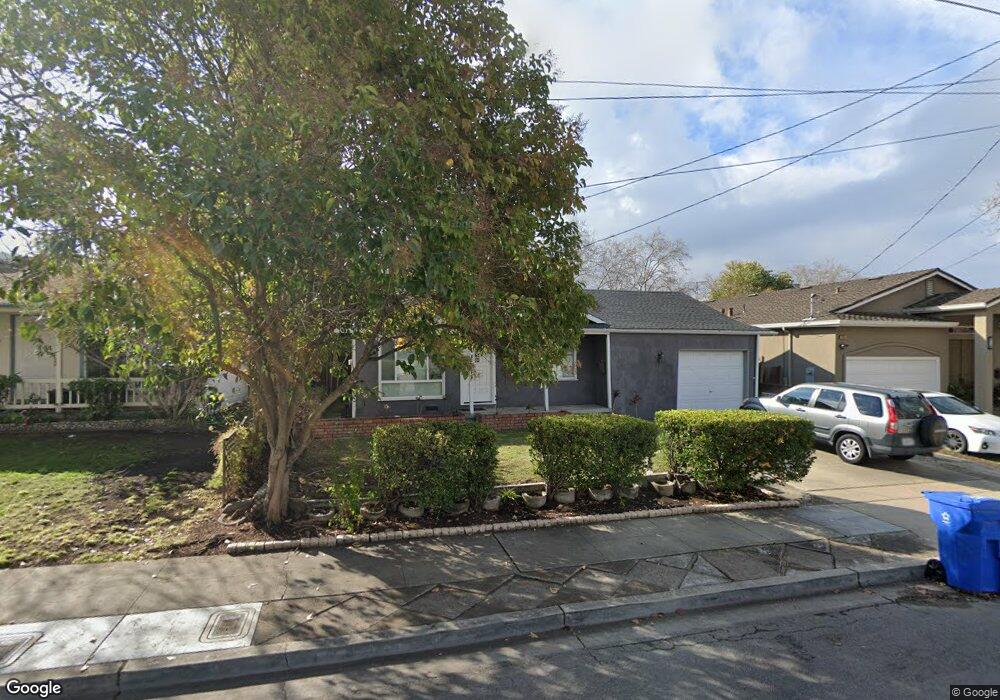
366 Escobar St Fremont, CA 94539
Mission San Jose NeighborhoodEstimated Value: $1,577,502 - $1,983,000
3
Beds
2
Baths
1,104
Sq Ft
$1,578/Sq Ft
Est. Value
About This Home
This home is located at 366 Escobar St, Fremont, CA 94539 and is currently estimated at $1,742,626, approximately $1,578 per square foot. 366 Escobar St is a home located in Alameda County with nearby schools including Mission San Jose Elementary School, William Hopkins Junior High School, and Mission San Jose High School.
Ownership History
Date
Name
Owned For
Owner Type
Purchase Details
Closed on
Jan 2, 2015
Sold by
Mandula Aravind and Mandula Selvee Aravind
Bought by
Gopalakrishna Dattathri Venkatesh and Gopalakrishna Maiya Vidya Belur
Current Estimated Value
Home Financials for this Owner
Home Financials are based on the most recent Mortgage that was taken out on this home.
Original Mortgage
$728,000
Outstanding Balance
$560,075
Interest Rate
3.96%
Mortgage Type
New Conventional
Estimated Equity
$1,182,551
Purchase Details
Closed on
May 21, 2012
Sold by
H & H Property Investments Inc
Bought by
Mandula Aravind and Mandula Selvee Aravind
Home Financials for this Owner
Home Financials are based on the most recent Mortgage that was taken out on this home.
Original Mortgage
$575,600
Interest Rate
3.85%
Mortgage Type
New Conventional
Purchase Details
Closed on
Jan 26, 2012
Sold by
Flores Linda S Stransky and Stransky Family Trust
Bought by
H & H Property Investments Inc
Purchase Details
Closed on
Oct 3, 2005
Sold by
Stransky Glen R and Stransky Glen
Bought by
Stransky Don J and Stransky Mildred E
Purchase Details
Closed on
Dec 30, 2004
Sold by
Stransky Charlene
Bought by
Stransky Glen
Home Financials for this Owner
Home Financials are based on the most recent Mortgage that was taken out on this home.
Original Mortgage
$367,000
Interest Rate
5.69%
Mortgage Type
Purchase Money Mortgage
Purchase Details
Closed on
Dec 20, 2004
Sold by
Stransky Don J and Stransky Mildred E
Bought by
Stransky Glen R
Home Financials for this Owner
Home Financials are based on the most recent Mortgage that was taken out on this home.
Original Mortgage
$367,000
Interest Rate
5.69%
Mortgage Type
Purchase Money Mortgage
Purchase Details
Closed on
Mar 19, 1999
Sold by
Stransky Glen
Bought by
Stransky Don J and Stransky Mildred E
Purchase Details
Closed on
May 16, 1997
Sold by
Stransky Charlene
Bought by
Stransky Glen
Home Financials for this Owner
Home Financials are based on the most recent Mortgage that was taken out on this home.
Original Mortgage
$41,000
Interest Rate
8.13%
Purchase Details
Closed on
May 9, 1997
Sold by
Stransky Don J and Stransky Mildred E
Bought by
Stransky Glen
Home Financials for this Owner
Home Financials are based on the most recent Mortgage that was taken out on this home.
Original Mortgage
$41,000
Interest Rate
8.13%
Create a Home Valuation Report for This Property
The Home Valuation Report is an in-depth analysis detailing your home's value as well as a comparison with similar homes in the area
Home Values in the Area
Average Home Value in this Area
Purchase History
| Date | Buyer | Sale Price | Title Company |
|---|---|---|---|
| Gopalakrishna Dattathri Venkatesh | $1,048,500 | Fidelity National Title Co | |
| Mandula Aravind | $719,500 | Old Republic Title Company | |
| H & H Property Investments Inc | $555,000 | Old Republic Title Company | |
| Stransky Don J | -- | Old Republic Title Company | |
| Stransky Glen | -- | Old Republic Title Company | |
| Stransky Glen | -- | Old Republic Title Company | |
| Stransky Glen R | $233,500 | Old Republic Title Company | |
| Stransky Don J | -- | -- | |
| Stransky Glen | -- | -- | |
| Stransky Glen | -- | Chicago Title Co | |
| Stransky Glen | $41,000 | Chicago Title Co |
Source: Public Records
Mortgage History
| Date | Status | Borrower | Loan Amount |
|---|---|---|---|
| Open | Gopalakrishna Dattathri Venkatesh | $728,000 | |
| Previous Owner | Mandula Aravind | $575,600 | |
| Previous Owner | Stransky Glen R | $367,000 | |
| Previous Owner | Stransky Glen | $41,000 |
Source: Public Records
Tax History Compared to Growth
Tax History
| Year | Tax Paid | Tax Assessment Tax Assessment Total Assessment is a certain percentage of the fair market value that is determined by local assessors to be the total taxable value of land and additions on the property. | Land | Improvement |
|---|---|---|---|---|
| 2025 | $14,814 | $1,259,496 | $600,905 | $658,591 |
| 2024 | $14,814 | $1,234,806 | $589,125 | $645,681 |
| 2023 | $14,429 | $1,210,597 | $577,575 | $633,022 |
| 2022 | $14,260 | $1,186,860 | $566,250 | $620,610 |
| 2021 | $13,907 | $1,163,594 | $555,150 | $608,444 |
| 2020 | $13,999 | $1,151,668 | $549,460 | $602,208 |
| 2019 | $13,837 | $1,129,094 | $538,690 | $590,404 |
| 2018 | $13,571 | $1,106,960 | $528,130 | $578,830 |
| 2017 | $13,232 | $1,085,256 | $517,775 | $567,481 |
| 2016 | $13,017 | $1,063,982 | $507,625 | $556,357 |
| 2015 | $9,377 | $751,948 | $225,532 | $526,416 |
| 2014 | $9,136 | $737,221 | $221,115 | $516,106 |
Source: Public Records
Map
Nearby Homes
- 341 Dana St
- 43150 Starr St
- 335 Via Rosario
- 42955 Corte Verde
- 42965 Corte Verde
- 905 Glenhill Dr
- 43547 Ellsworth St
- 483 Becado Place
- 138 Telles Ln
- 124 Linmore Dr
- 646 Bella Vista Ct
- 42226 Camino Santa Barbara
- 1298 Ocaso Camino
- 43555 Puesta Del Sol
- 2164 Ocaso Camino
- 636 Praderia Cir
- 42099 Vinha Way
- 42329 Troyer Ave
- 231 Cavalo Ct
- 2225 Valorie St