Estimated Value: $549,510 - $567,000
4
Beds
2
Baths
2,150
Sq Ft
$260/Sq Ft
Est. Value
About This Home
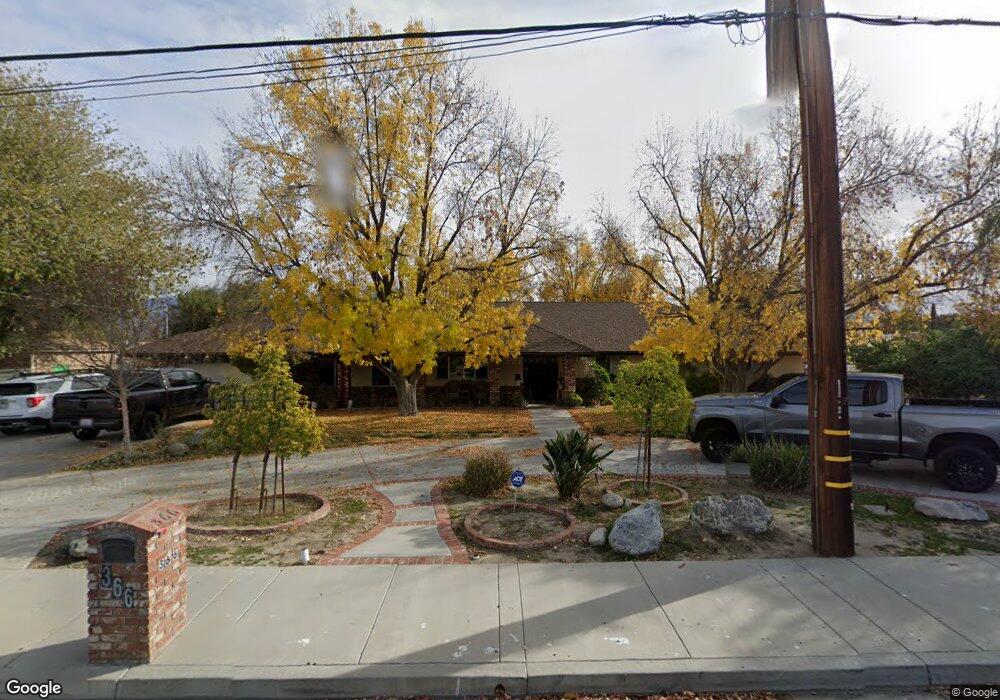
This home is located at 366 N Soboba St, Hemet, CA 92544 and is currently estimated at $559,878, approximately $260 per square foot. 366 N Soboba St is a home located in Riverside County with nearby schools including Bautista Creek Elementary School, Acacia Middle School, and Hemet High School.
Ownership History
Date
Name
Owned For
Owner Type
Purchase Details
Closed on
Nov 12, 2024
Sold by
Marshall Brian Fenton and Marshall Dianna Lynn
Bought by
Brian Fenton Marshall And Dianna Lynn Marshal and Marshall
Current Estimated Value
Purchase Details
Closed on
Apr 13, 2017
Sold by
Marshall Brian
Bought by
Marshall Brian and Marshall Dianna
Purchase Details
Closed on
Mar 27, 2006
Sold by
Marshall Dianna
Bought by
Marshall Brian
Home Financials for this Owner
Home Financials are based on the most recent Mortgage that was taken out on this home.
Original Mortgage
$274,350
Interest Rate
6.29%
Mortgage Type
Fannie Mae Freddie Mac
Purchase Details
Closed on
Jan 2, 1996
Sold by
Page Bruce G and Page Kathryn S
Bought by
Marshall Brian and Marshall Dianna
Home Financials for this Owner
Home Financials are based on the most recent Mortgage that was taken out on this home.
Original Mortgage
$154,908
Interest Rate
7.14%
Mortgage Type
FHA
Create a Home Valuation Report for This Property
The Home Valuation Report is an in-depth analysis detailing your home's value as well as a comparison with similar homes in the area
Home Values in the Area
Average Home Value in this Area
Purchase History
| Date | Buyer | Sale Price | Title Company |
|---|---|---|---|
| Brian Fenton Marshall And Dianna Lynn Marshal | -- | None Listed On Document | |
| Marshall Brian Fenton | -- | None Listed On Document | |
| Marshall Brian | -- | None Available | |
| Marshall Brian | -- | Lawyers Title Co | |
| Marshall Brian | $165,000 | Commonwealth Land Title Co |
Source: Public Records
Mortgage History
| Date | Status | Borrower | Loan Amount |
|---|---|---|---|
| Previous Owner | Marshall Brian | $274,350 | |
| Previous Owner | Marshall Brian | $154,908 |
Source: Public Records
Tax History Compared to Growth
Tax History
| Year | Tax Paid | Tax Assessment Tax Assessment Total Assessment is a certain percentage of the fair market value that is determined by local assessors to be the total taxable value of land and additions on the property. | Land | Improvement |
|---|---|---|---|---|
| 2025 | $3,343 | $305,594 | $66,424 | $239,170 |
| 2023 | $3,343 | $293,730 | $63,846 | $229,884 |
| 2022 | $3,231 | $287,972 | $62,595 | $225,377 |
| 2021 | $3,176 | $282,326 | $61,368 | $220,958 |
| 2020 | $3,136 | $279,432 | $60,739 | $218,693 |
| 2019 | $3,066 | $273,954 | $59,549 | $214,405 |
| 2018 | $2,969 | $268,583 | $58,383 | $210,200 |
| 2017 | $2,931 | $263,318 | $57,239 | $206,079 |
| 2016 | $2,908 | $258,156 | $56,117 | $202,039 |
| 2015 | $2,898 | $254,280 | $55,275 | $199,005 |
| 2014 | $2,765 | $249,301 | $54,194 | $195,107 |
Source: Public Records
Map
Nearby Homes
- 255 Mosport St
- 144 Zolder St
- 25186 Lake St
- 5323 Orange Grove Ave
- 222 Marmalade Ln
- 402 Lombard Ct
- 171 N Hemet St
- 4316 Valentine Ln
- 437 Winthrop Dr
- 42259 State Highway 74
- 42874 Woodside Ct
- 657 N Hemet St
- 42751 E Florida Ave Unit 103
- 42751 E Florida Ave Unit 19
- 42751 E Florida Ave Unit 163
- 25056 Sansome St
- 4455 Brighton Ct
- 4605 Butterfield Way
- 759 Pike Dr
- 0 E Florida Ave Unit SW18200213
- 390 N Soboba St
- 342 N Soboba St
- 353 N Soboba St
- 373 N Soboba St
- 410 N Soboba St
- 331 N Soboba St
- 399 N Soboba St
- 320 N Soboba St
- 345 Juel St
- 425 N Soboba St
- 365 Juel St
- 436 N Soboba St
- 4982 Heath Way
- 325 Juel St
- 4822 Lincoln Ave
- 305 Juel St
- 4782 Lincoln Ave
- 5008 Heath Way
- 4782 E Lincoln Ave
- 4712 Lincoln Ave